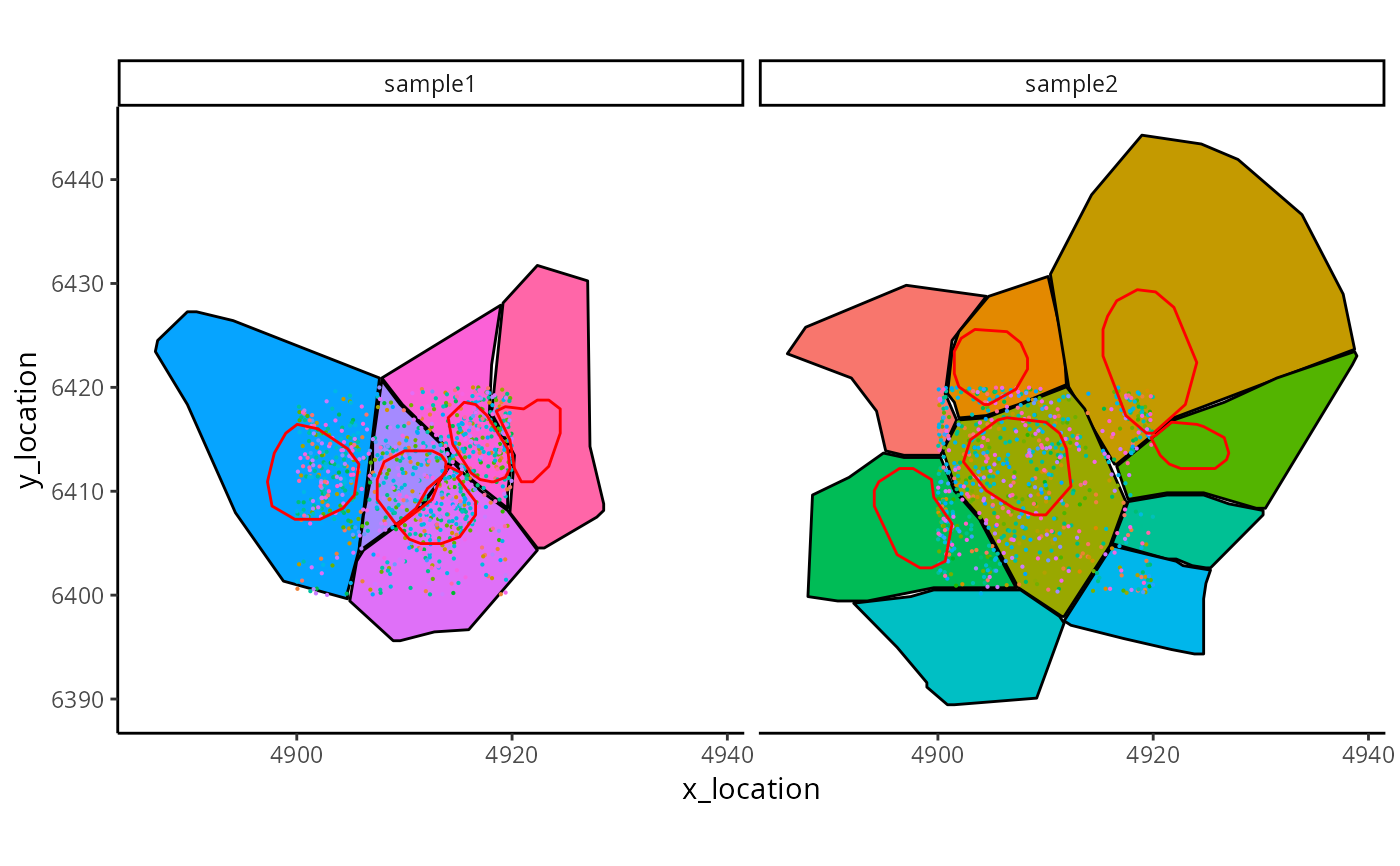
A set of ggplot functions to build customized plots for imaging based spatial transcriptomics data.
Usage
ggplot_me()

geom_point_me(me, assayName = "detected", byColour = NULL, ...)

geom_polygon_me(me, assayName = "cell", byFill = NULL, ...)
Arguments
- me
MoleculeExperiment object.
- assayName
Character string specifying name of assay from which to get data.
- byColour
Character string specifying the column name to colour by.
- ...
Additional parameters to be passed to ggplot.
- byFill
Character string specifying the column name to fill by.
Value
A plot with transcripts and/or segmentation information for imaging based spatial transcriptomics data.
Examples
repoDir <- system.file("extdata", package = "MoleculeExperiment")
repoDir <- paste0(repoDir, "/xenium_V1_FF_Mouse_Brain")
me <- readXenium(repoDir,
                  keepCols = "essential",
                  addBoundaries = c("cell", "nucleus"))

g = ggplot_me() +
        geom_polygon_me(me, byFill = "segment_id", colour = "black") +
        geom_point_me(me, byColour = "feature_id", size = 0.1) +
        geom_polygon_me(me, assayName = "nucleus", fill = NA, colour = "red")
g
