Plot experts network
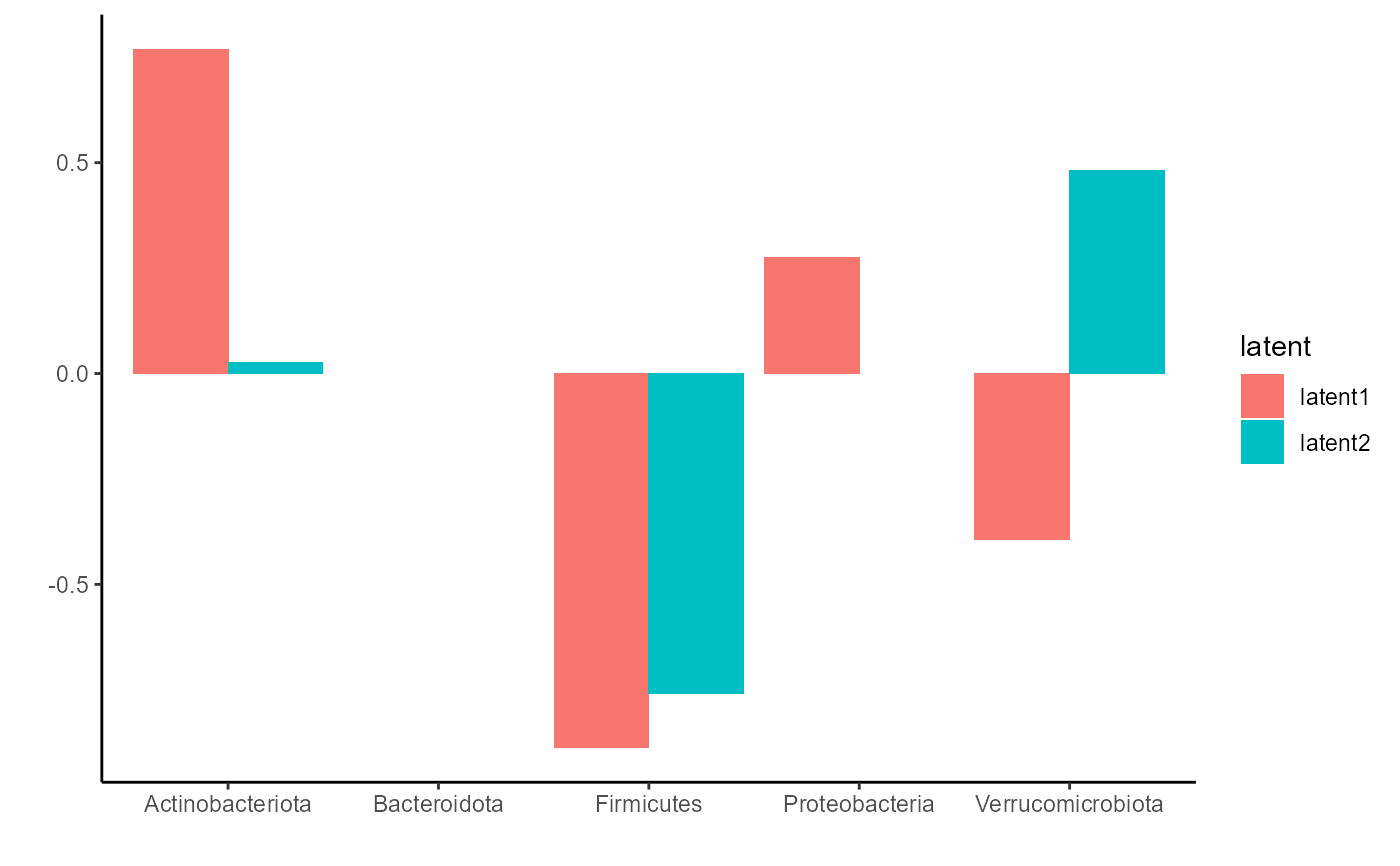
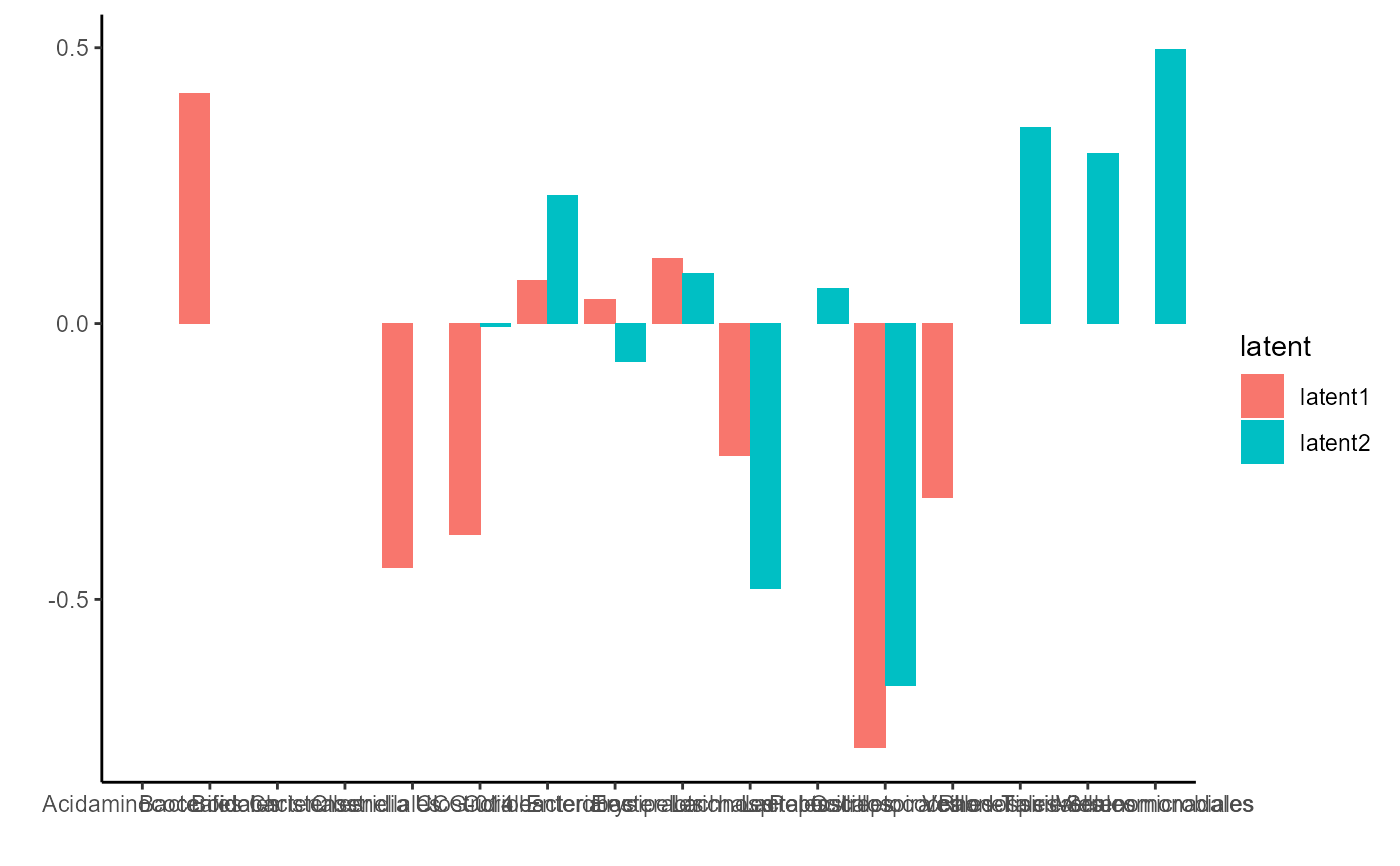
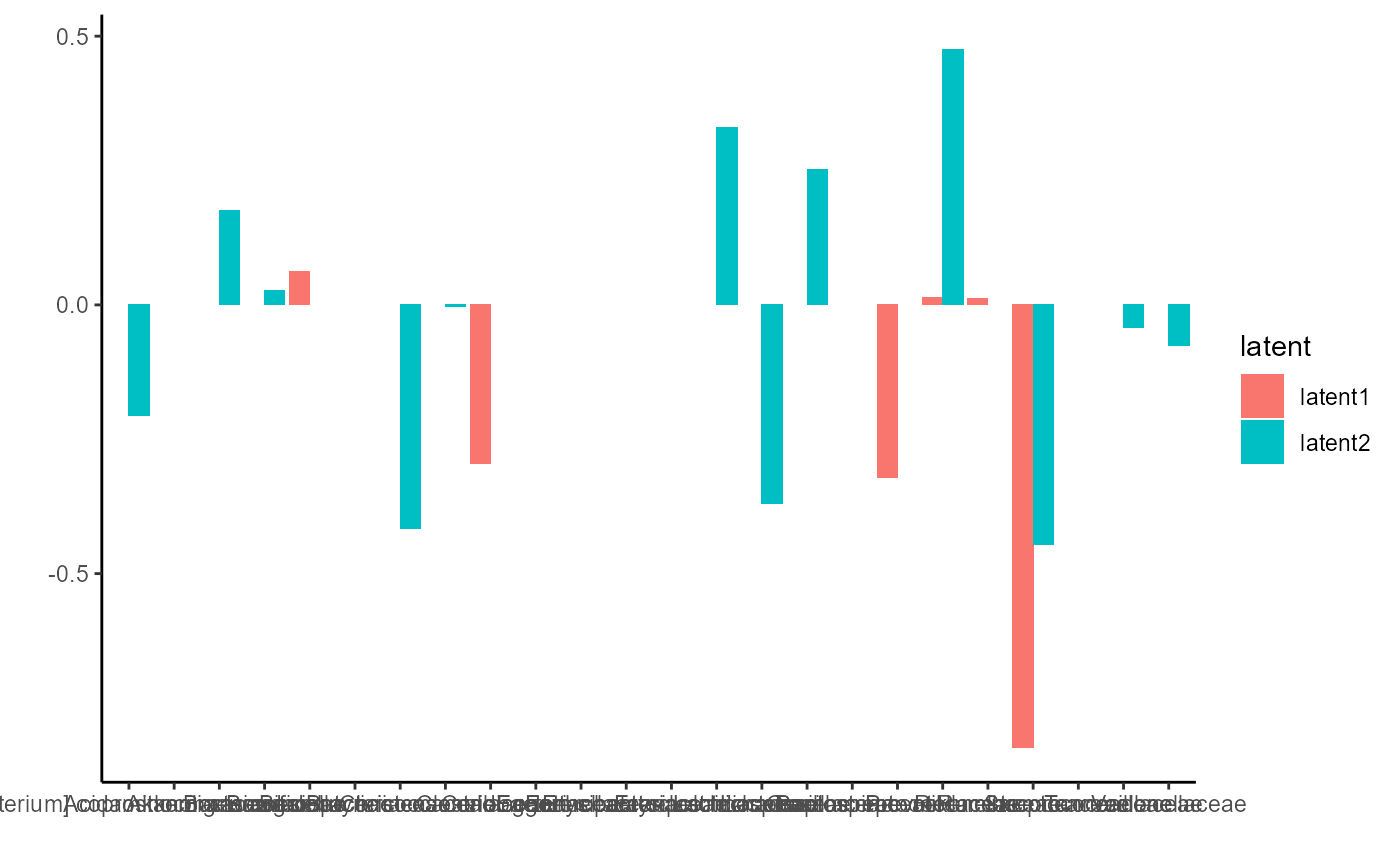
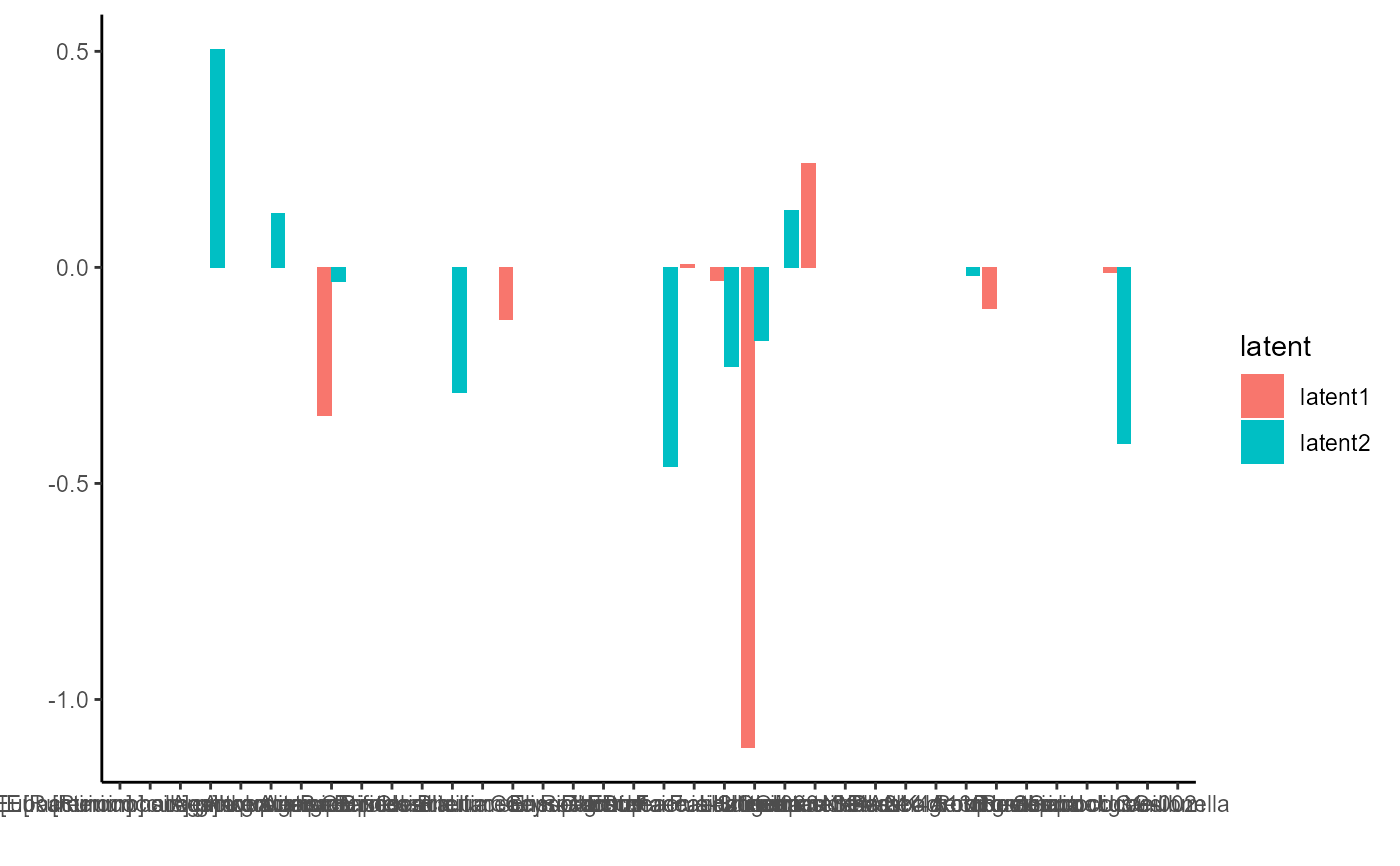
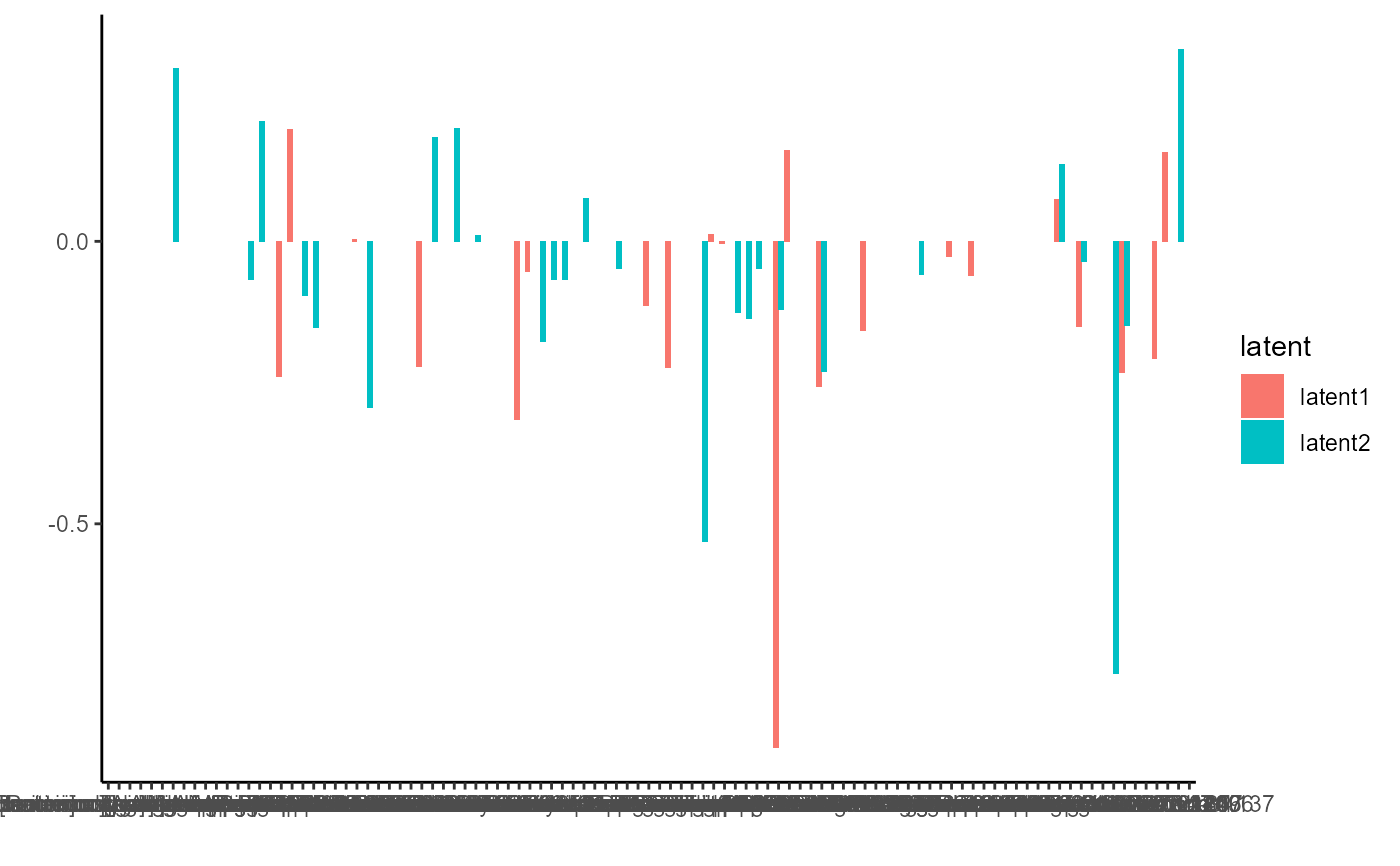
plotExperts.RdThis function plot the estimated coefficients of each latent class on each level.
plotExperts(NEMoE_obj)
Arguments
| NEMoE_obj | a NEMoE object with fitted output. |
|---|
Value
A list of graph of fitted coefficients of each latent class on each level.
Examples
#> [[1]]#> #> [[2]]#> #> [[3]]#> #> [[4]]#> #> [[5]]#>