Plot gating network
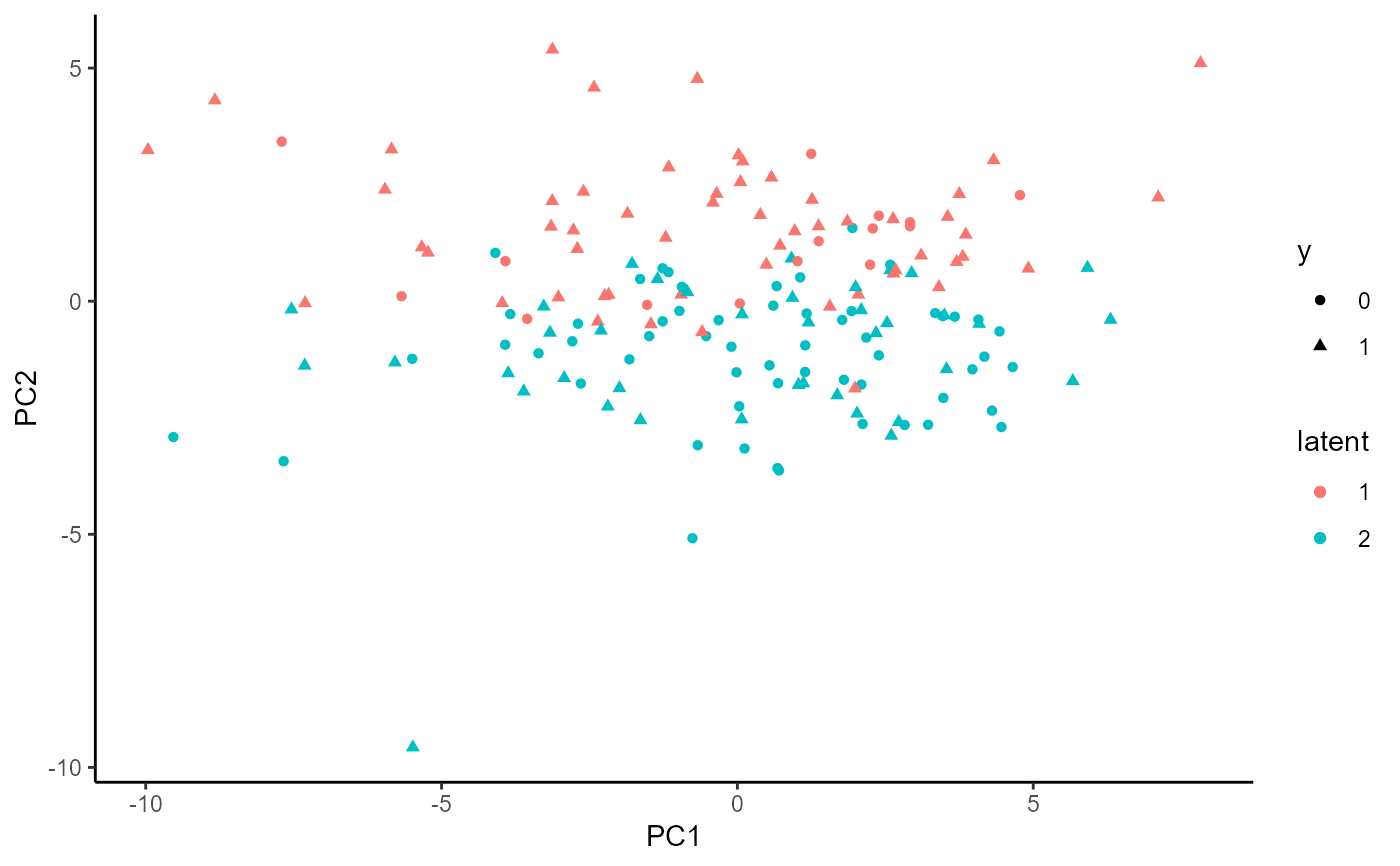
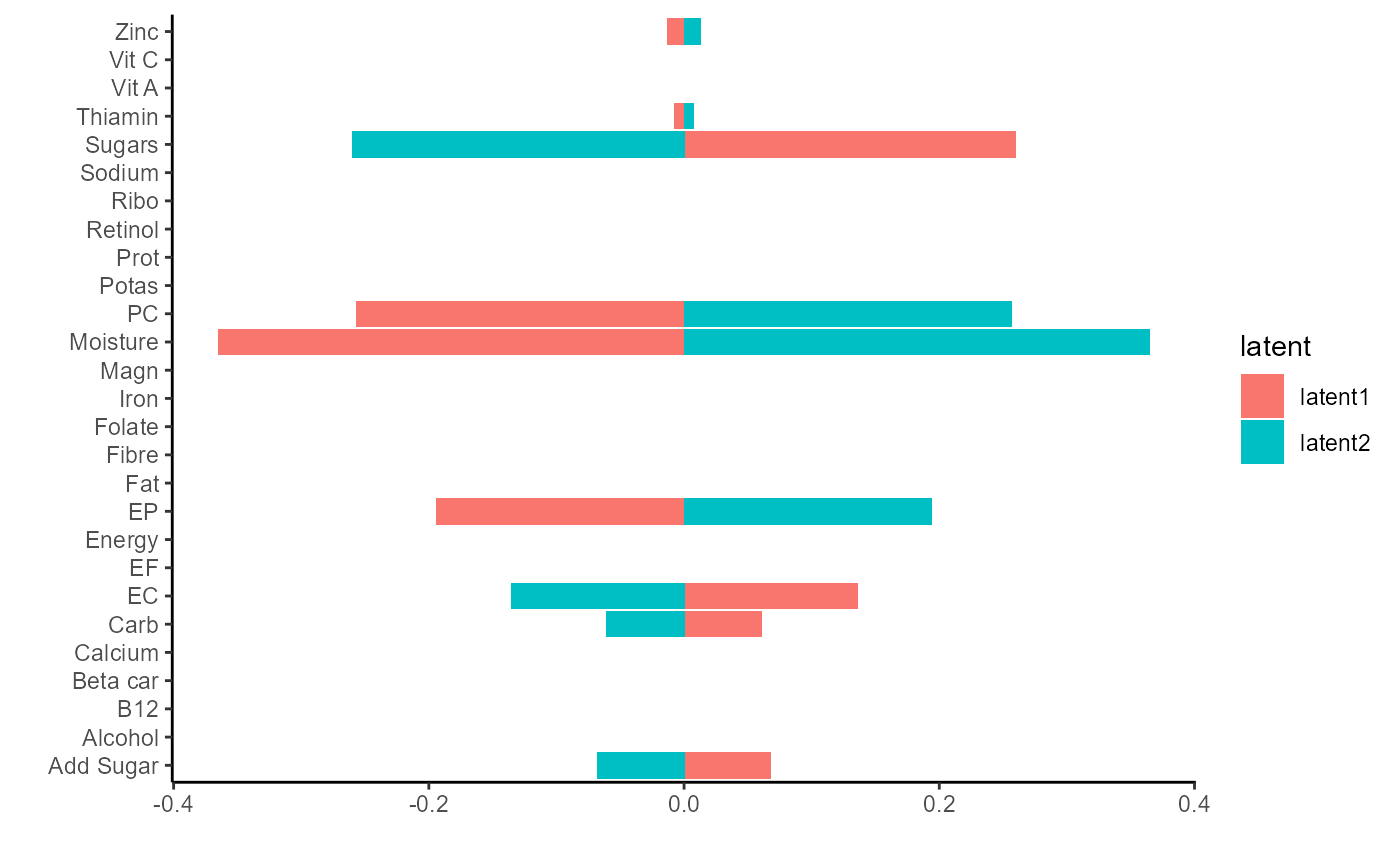
plotGating.RdThis function plot the PCA of fitted latent class and their corresponding loadings.
plotGating(NEMoE_obj, PCs = c(1, 2))
Arguments
| NEMoE_obj | a NEMoE object with fitted output. |
|---|---|
| PCs | Visualization of selected Principal components. |
Value
A graph of PCA plot of nutrition intake and estimated latent classes and its corresponding loadings.
Examples
#> [[1]]#> #> [[2]]#>