Mouse Liver Data
Kevin Wang
12 Apr 2024
Source:vignettes/case_study/Mouse_Liver_Data.Rmd
Mouse_Liver_Data.RmdIntroduction
This is a mouse liver single-cell data comprising of 4 different experiments with 3 different protocols.
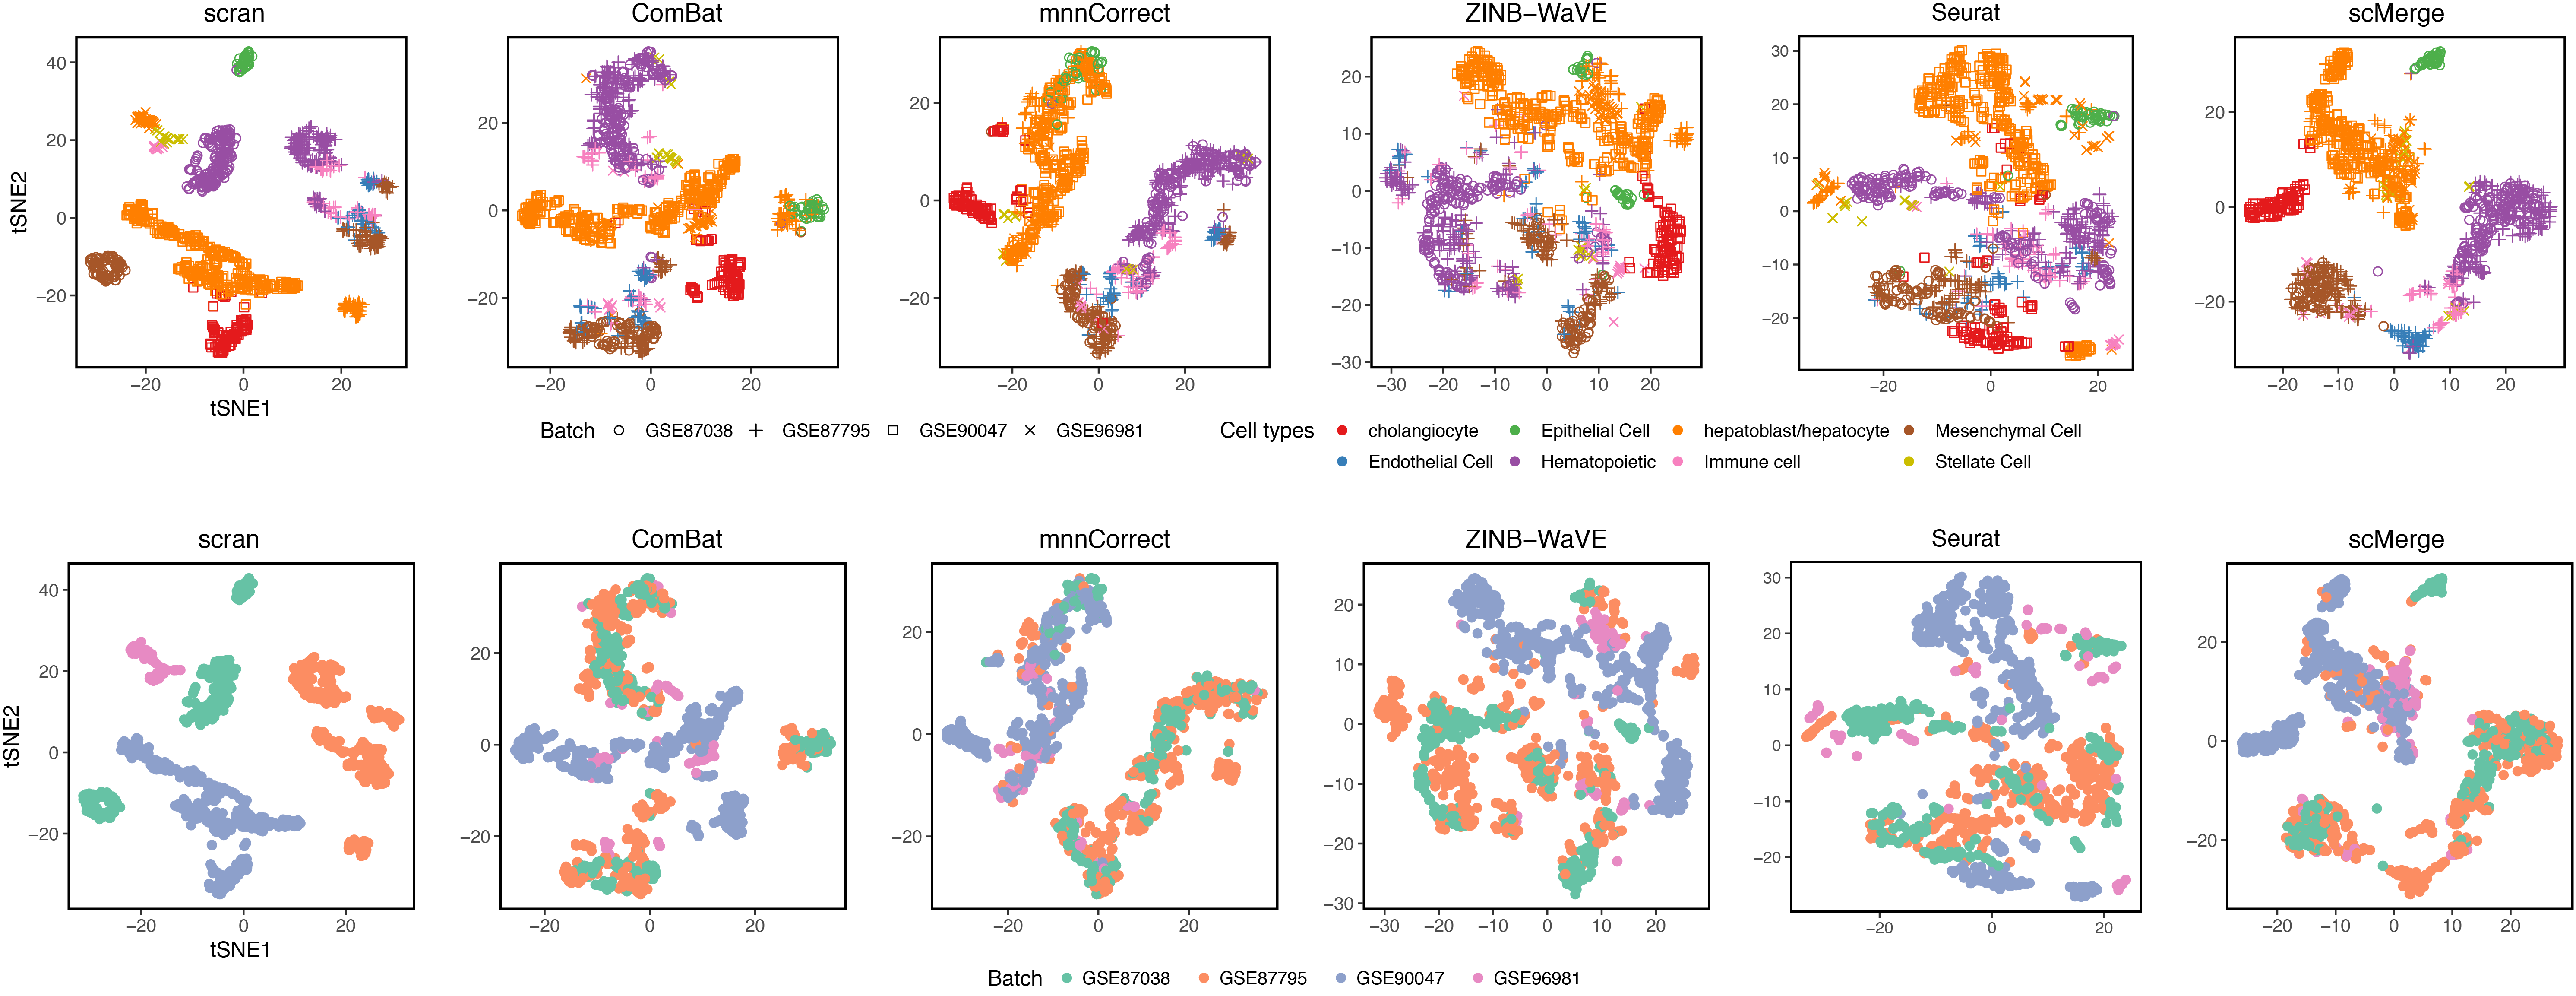
Integration challenge
- Prior to integration, there is a strong separation effect by batches.
- The liver cell developments should have a clear trajectory, this
biological process was not clear from the pre-integrated data. In the
scMerge-integrated, this trajectory was estimated with higher degree of biological interpretability.
| Name | ID | Author | DOI or URL | Protocol | Organism | Tissue | # of cell types | # of cells | # of batches |
|---|---|---|---|---|---|---|---|---|---|
| Liver | GSE87795 | Su | 10.1186/s12864-017-4342-x | SMARTer/C1 | Mouse | Liver | 6 | 1236 | |
| GSE90047 | Yang | 10.1002/hep.29353 | Smart-Seq2 | 2 | |||||
| GSE87038 | Dong | 10.1186/s13059-018-1416-2 | STRT-seq | 3 | |||||
| GSE96981 | Camp | 10.1038/nature22796 | SMARTer/C1 | 3 |
- Relation to the
scMergearticle: Main Figure 3b and Supplementary Figure 8.
Data visualisation
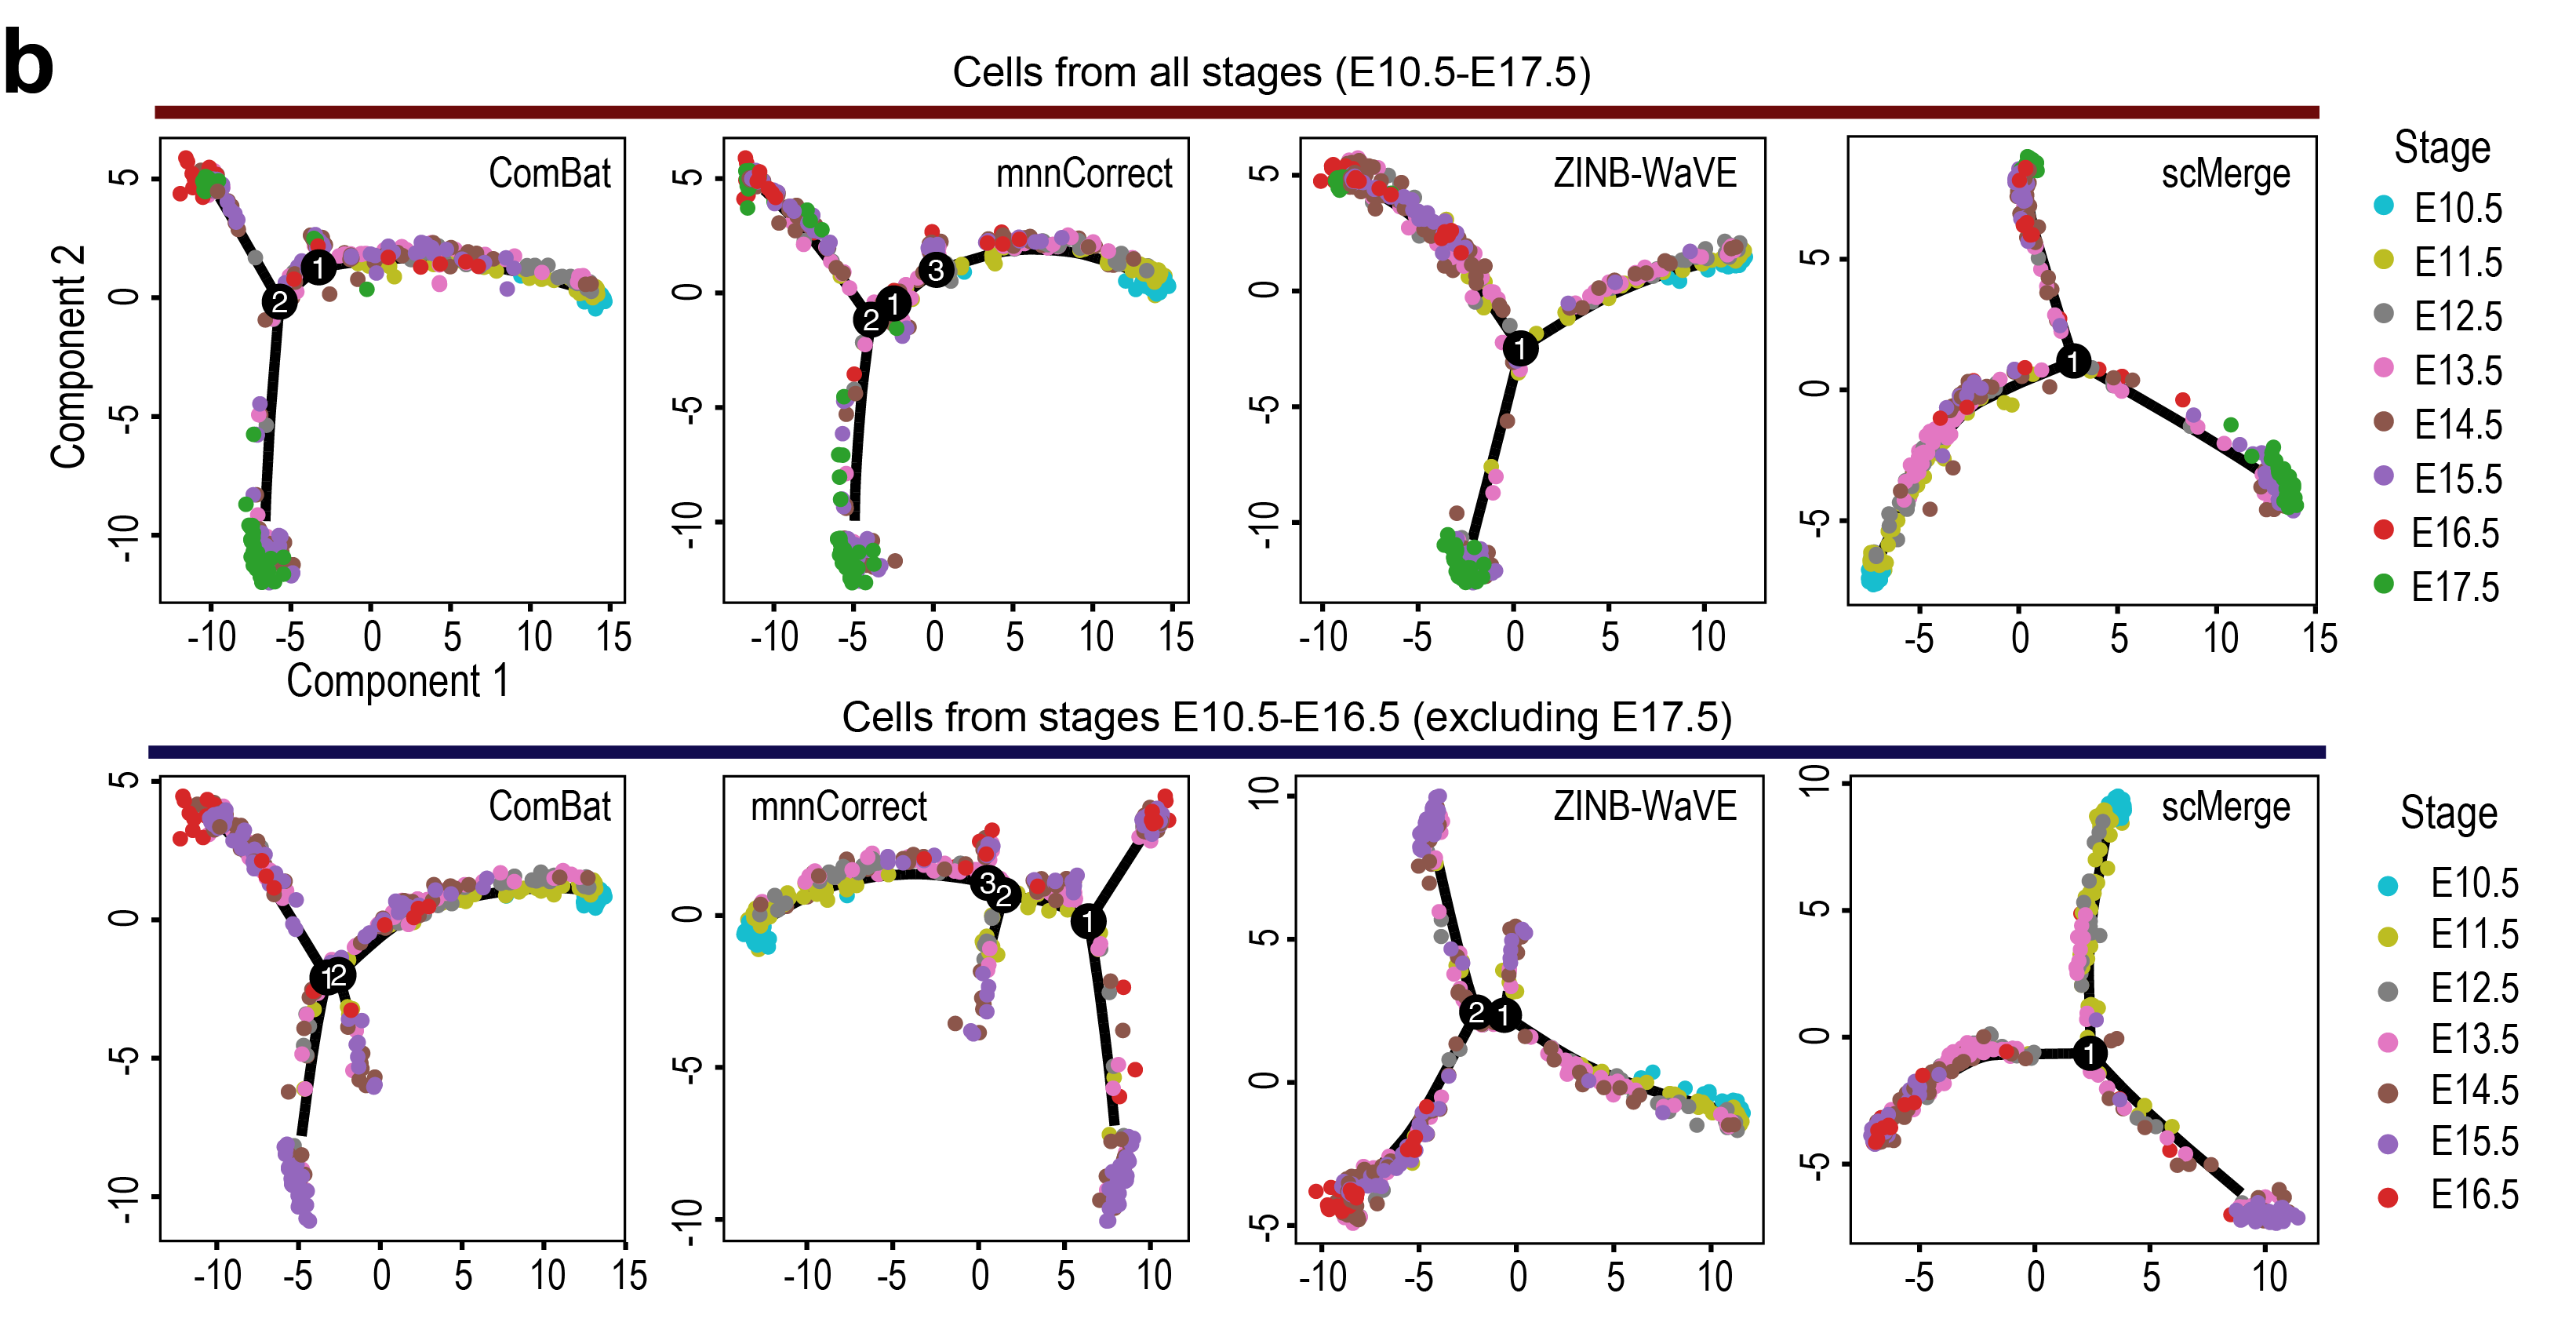
Monocle2 cell trajectory plot
Some remarks:
To combine the four liver scRNA-seq datasets, we used a semi-supervised approach by considering the developmental stages as the wanted variation to identify the pseudo-replicates. Note that the cells of the four liver datasets are from different fetal mouse liver developmental stages (E9.5-E17.5). To identify the pseudo-replicates corresponding to the hepatoblasts, hepatocytes and cholangiocytes, we used three known markers of hepatoblasts and cholangiocytes, Alb, Afp and Epcam, to guide the
scMergealgorithm. The sets of pseudo-replicates that are highly expressed the markers are further split according to the developmental stages.In addition to integrating 4 scRNA-Seq datasets,
scMergerevealed a novel result: We constructed the cell trajectories with cells corresponding to the E17.5 time point of GSE90047 removed. We found that the trajectory associated withscMergeis most consistent with the full Liver data collection and agrees with current literature, while other methods tended to generate extraneous branches with the subset of the Liver data collection.We further performed SC3 on the
scMergeintegrated data (k=9). We found that the SC3 clustering results have high concordance with the original cell types.
Integrated scMerge data
Data availability: Mouse Liver Data (in RData format)
-
scMergeparameters for integration:- semi-supervised scMerge
- kmeans K = (6,2,3,3)
- Negative controls are mouse scSEG
- WV = developmental stage
- WV_marker = “Afp”,“Alb”,“Epcam”