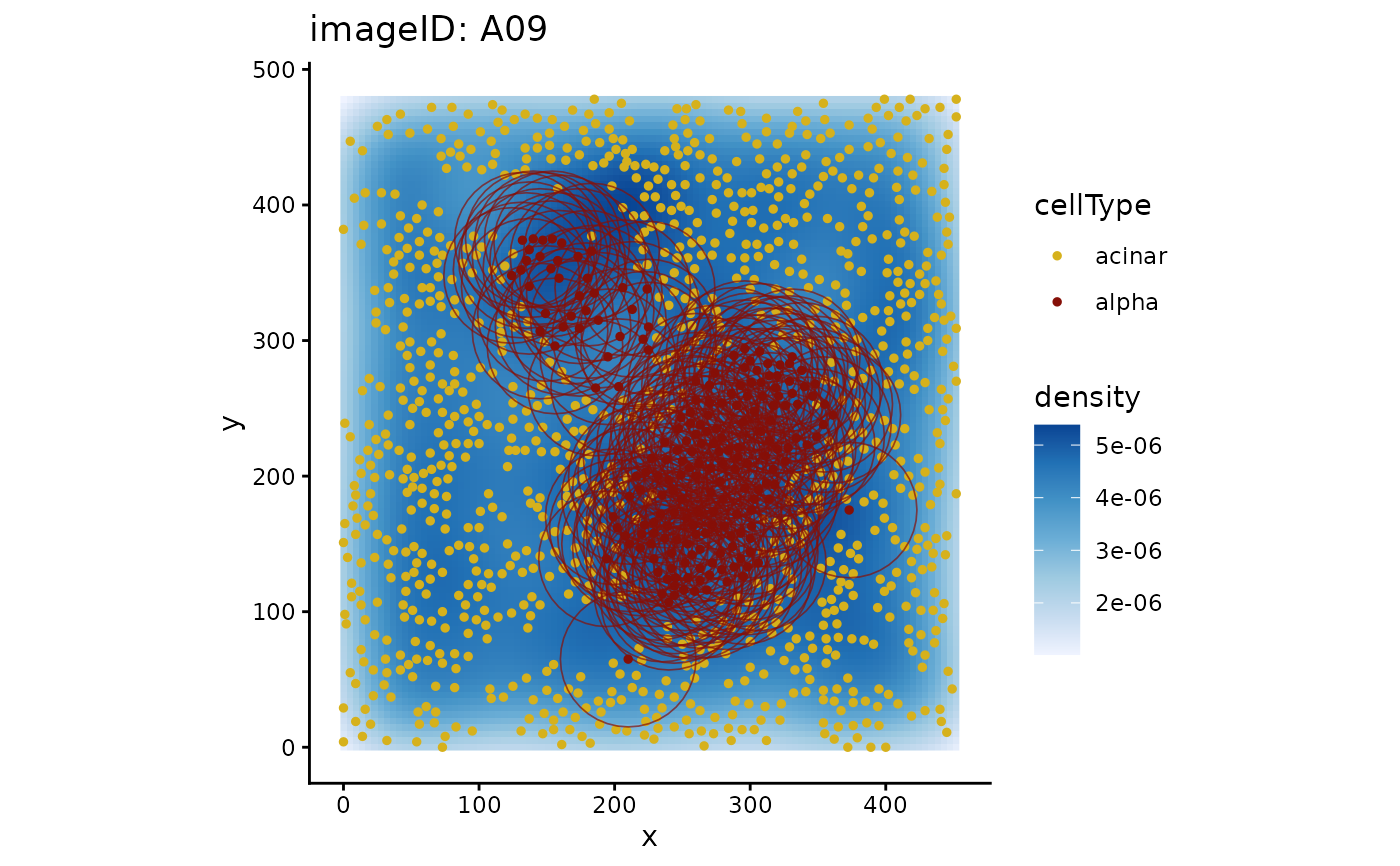
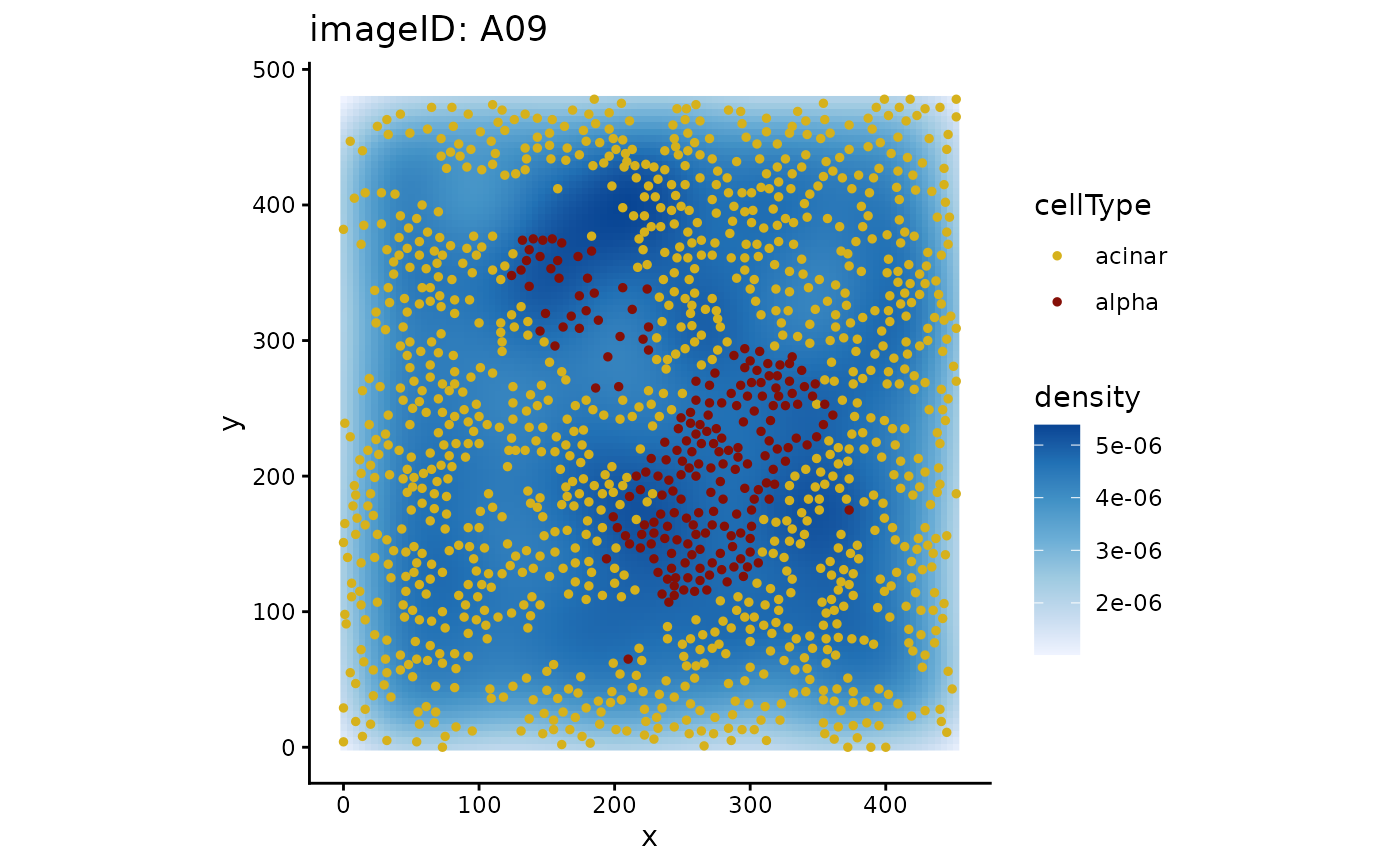
The density of all cells is shown in blue, with the from and to cells on top. With r, a circle of
radius r is drawn around each to cell: the from cells inside the circles are those that spicyR counts.
Usage
plotImage(
  cells,
  imageToPlot,
  from,
  to,
  imageID = "imageID",
  cellType = "cellType",
  spatialCoords = c("x", "y"),
  r = NULL
)
Arguments
- cells
A SummarizedExperiment object.
- imageToPlot
The ID of the image to be plotted.
- from
The "from" cell type.
- to
The "to" cell type.
- imageID
The name of the imageID column in the SummarizedExperiment object.
- cellType
The name of the cellType column in the SummarizedExperiment object.
- spatialCoords
The names of the spatialCoords column if using a SingleCellExperiment.
- r
Optional radius: draw a circle of this radius around each
tocell.
Examples
data("diabetesData")
plotImage(diabetesData, "A09", from = "acinar", to = "alpha")
 plotImage(diabetesData, "A09", from = "acinar", to = "alpha", r = 50)