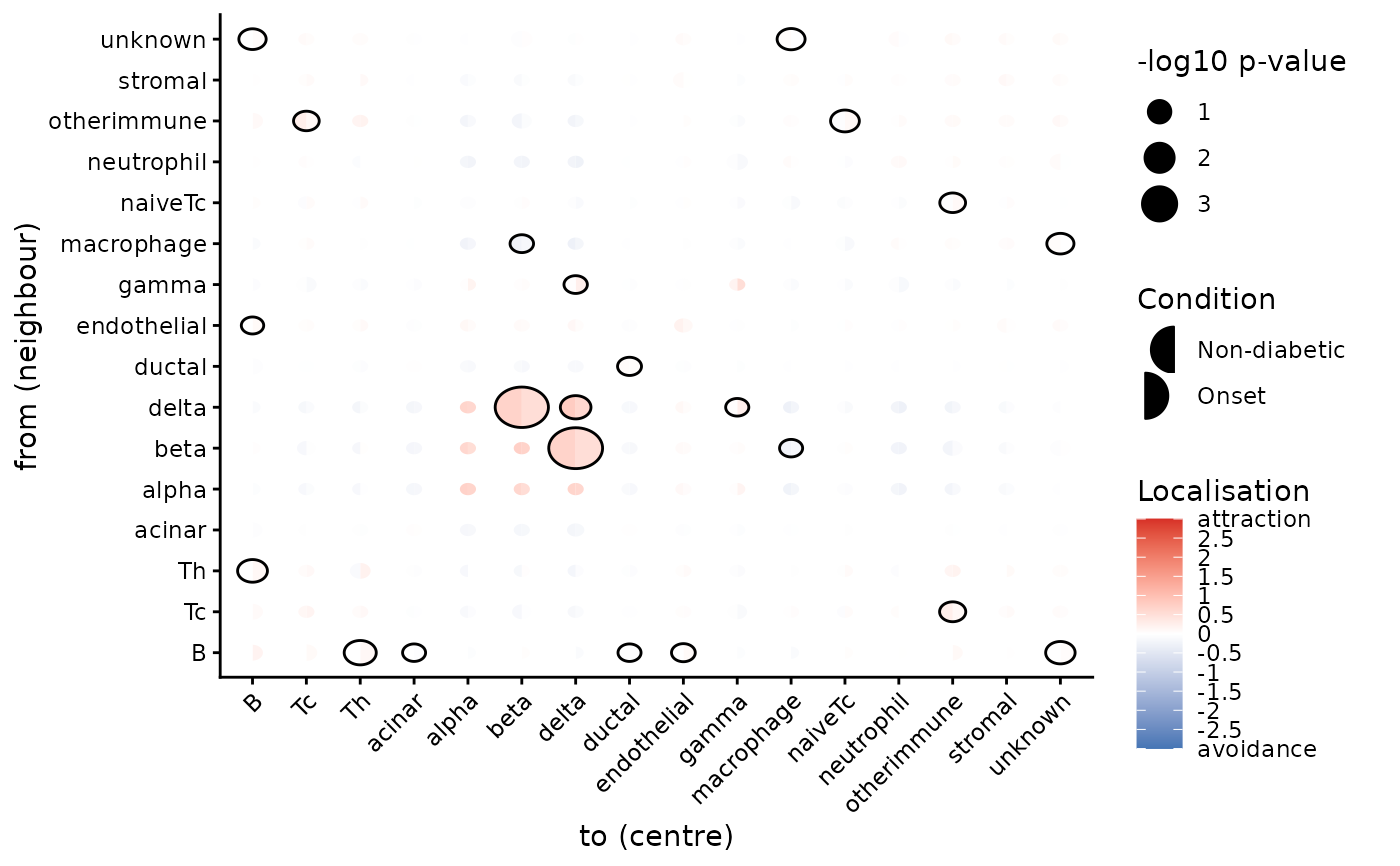
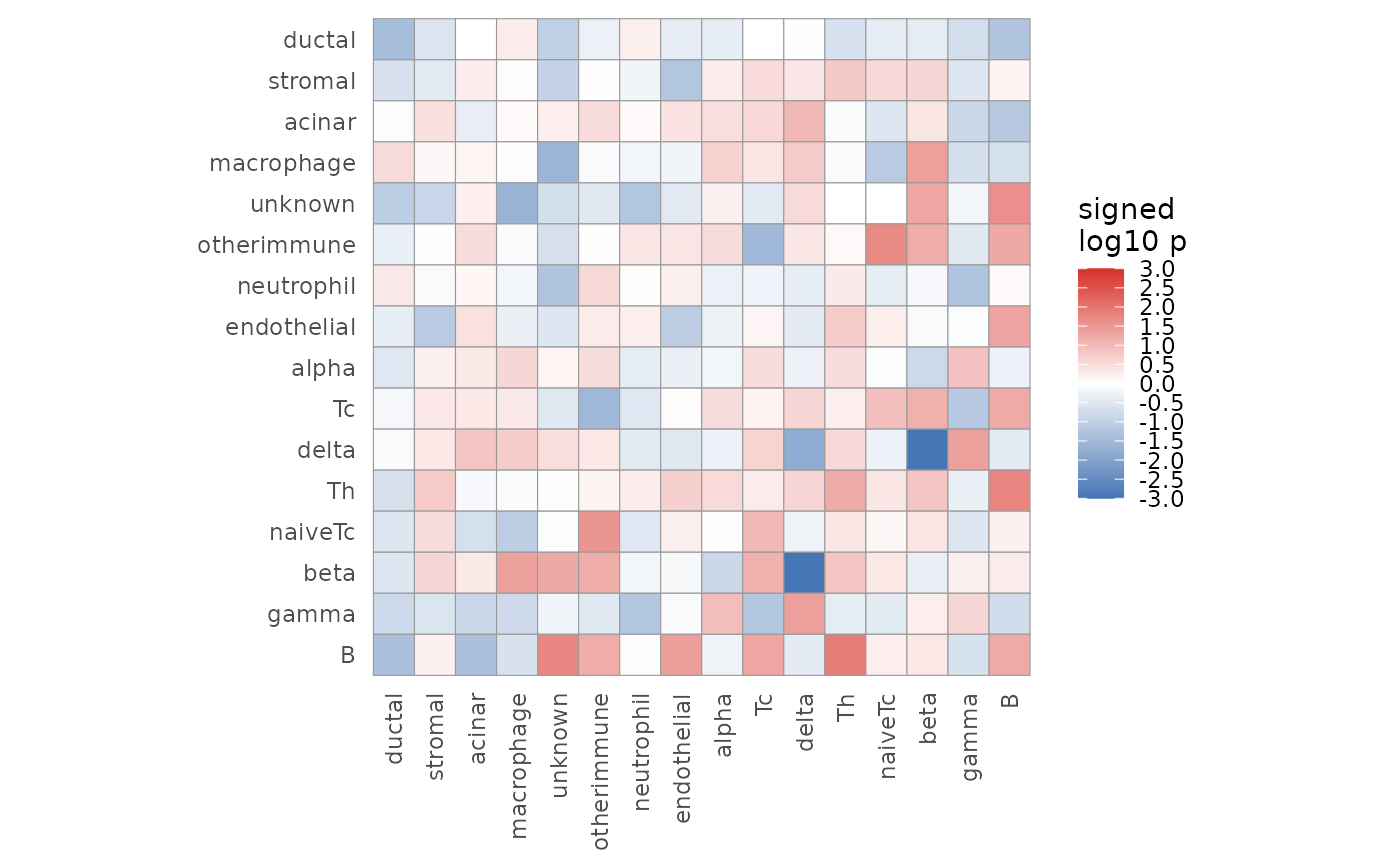
Plots result of signifPlot.
Usage
signifPlot(
  results,
  fdr = FALSE,
  type = "bubble",
  breaks = NULL,
  comparisonGroup = NULL,
  colours = c("#4575B4", "white", "#D73027"),
  marksToPlot = NULL,
  cutoff = 0.05,
  contextColours = NULL,
  contextLabels = waiver()
)
Arguments
- results
A spicy results object
- fdr
TRUE if FDR correction is used.
- type
Whether to make a bubble plot (
"bubble") or a heatmap (any other value). Note: For survival results a bubble plot will be used.- breaks
Vector of 3 numbers giving breaks used in legend. The first number is the minimum, the second is the maximum, the third is the number of breaks.
- comparisonGroup
A string specifying the name of the outcome group to compare with the base group.
- colours
Vector of colours to use to colour legend.
- marksToPlot
Vector of marks to include in plot.
- cutoff
significance threshold for circles in bubble plot.
- contextColours
Used for
Kontextualresults. A named list specifying the colours for each context. By default the Tableau colour palette is used.- contextLabels
Used for
Kontextualresults. A named list to change the default labels for each context.