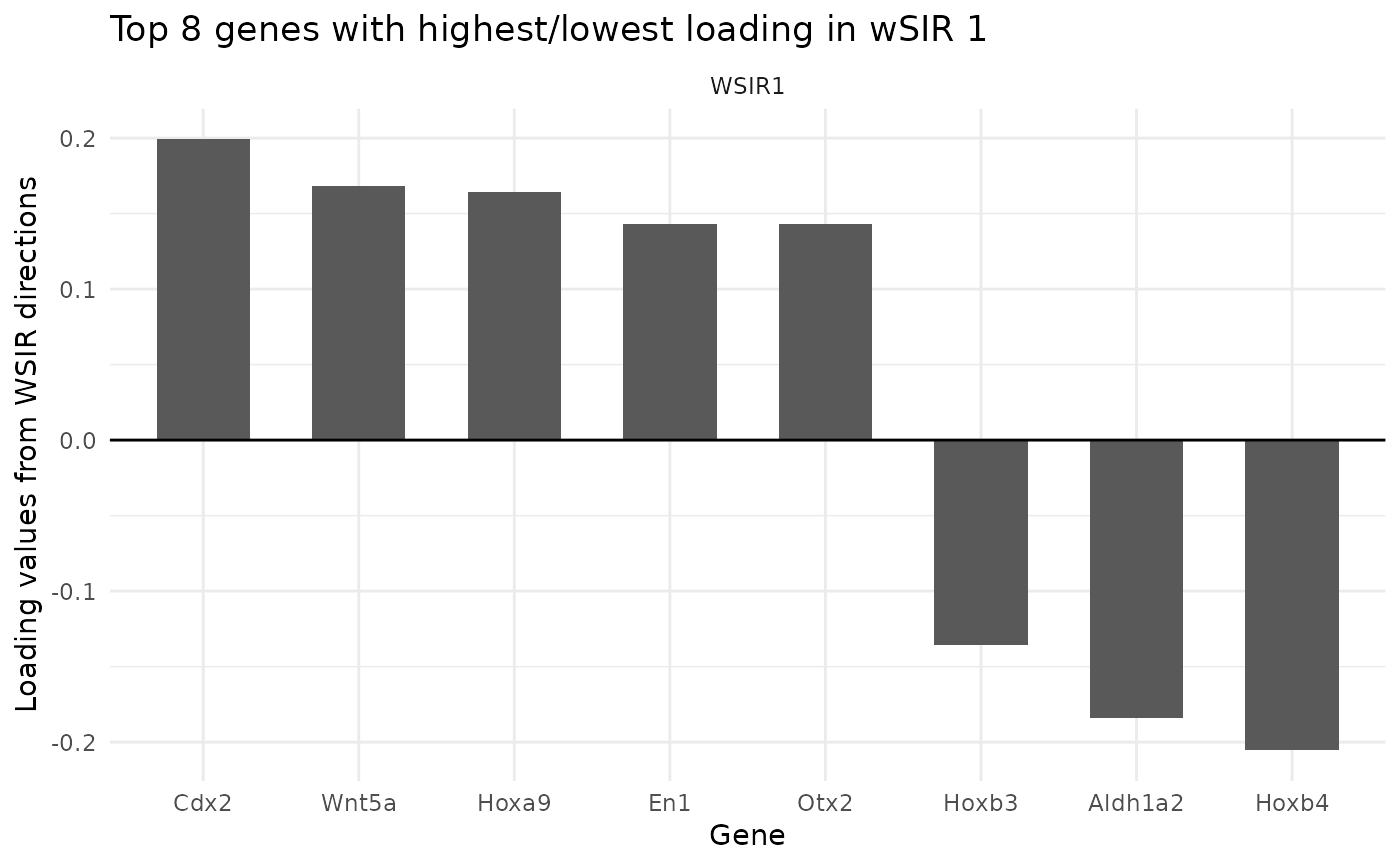
A function to find and visualise the genes with the highest (in absolute value) loading in WSIR1. These genes contribute the most to the first low-dimensional direction.
Arguments
- WSIR
wsir object as output of wSIR function. To analyse a different DR method, ensure the slot named 'directions' contains the loadings as a matrix with the gene names as the rownames.
- highest
integer for how many of the top genes you would like to see. Recommend no more than 20 for ease of visualisation. Default is 10.
- dirs
integer or vector for which direction / directions you want to show/find the top genes from.
Value
List containing two slots. First is named "plot" and shows a barplot with the top genes and their corresponding loadings. Second is named "genes" and is a dataframe of the genes with highest (in absolute value) loading in the specified low-dimensional directions. There are three columns: gene name, loading value, and which direction it is in. The number of columns is the product of parameters highest and dirs.