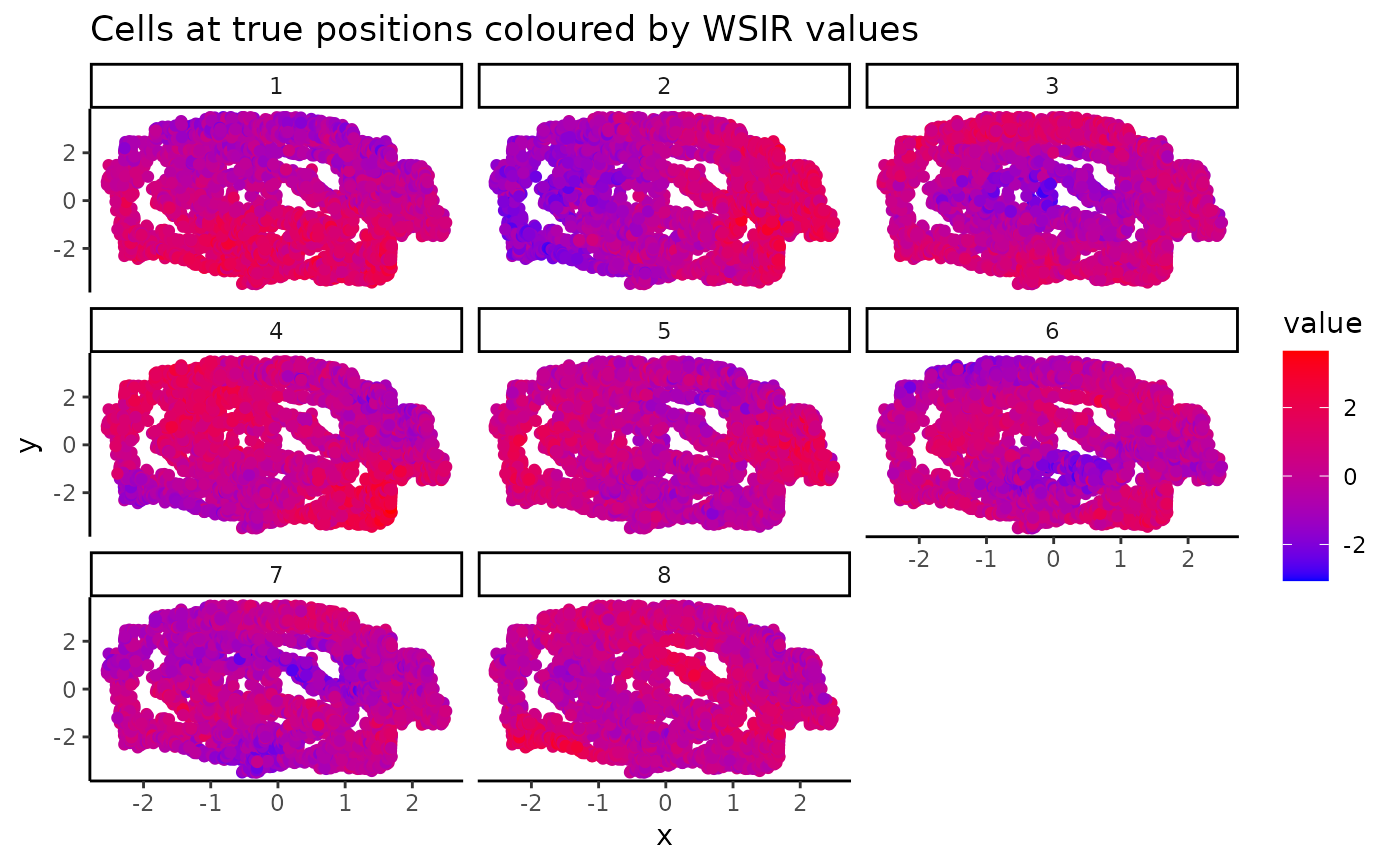
A function to easily visualise the low-dimensional gene expression data. This function plots each cell at its true spatial coordinates, coloured by their values for WSIR1 / WSIR2 / ... . The plots give an intuition about what biological signals are contained in the WSIR directions.
Arguments
- coords
dataframe containing spatial positions of n cells in 2D space. Dimension n * 2. Column names must be c("x", "y").
- WSIR
wsir object as output of wSIR function. To analyse a different DR method, ensure the slot named 'directions' contains the loadings as a matrix with the gene names as the rownames. Must have used the same coords parameter as in coords parameter for this function.
- dirs
integer for how many of the low-dimensional directions you would like to visualise. Recommend no more than 10 for ease of visualisation. Default is 6.
- mincol
String for the colour of low values of low-dimensional directions. Personal choice for user, default is "blue".
- maxcol
String for the colour of high values of low-dimensional directions. Personal choice for user, default is "red".
