Plot a ratio network
cpop_network.RdPlot ratio network
plot_lratio_network(x, type = "ggraph")

lratio_to_network(x)

mst_lratio(x)
Arguments
- x
A character vector representing edges by separating nodes with "--" i.e. in the form of "e1--e2"
- type
Type of graphical visualisation, currently only support one of "visNetwork" (interactive graph).
"ggraph" (default): a non-interactive graph visualisation using the `ggraph` package.
"igraph": a `igraph` object from the `igraph` package.
"visNetwork": an interactive graph visualisation using the `visNetwork` package
Examples
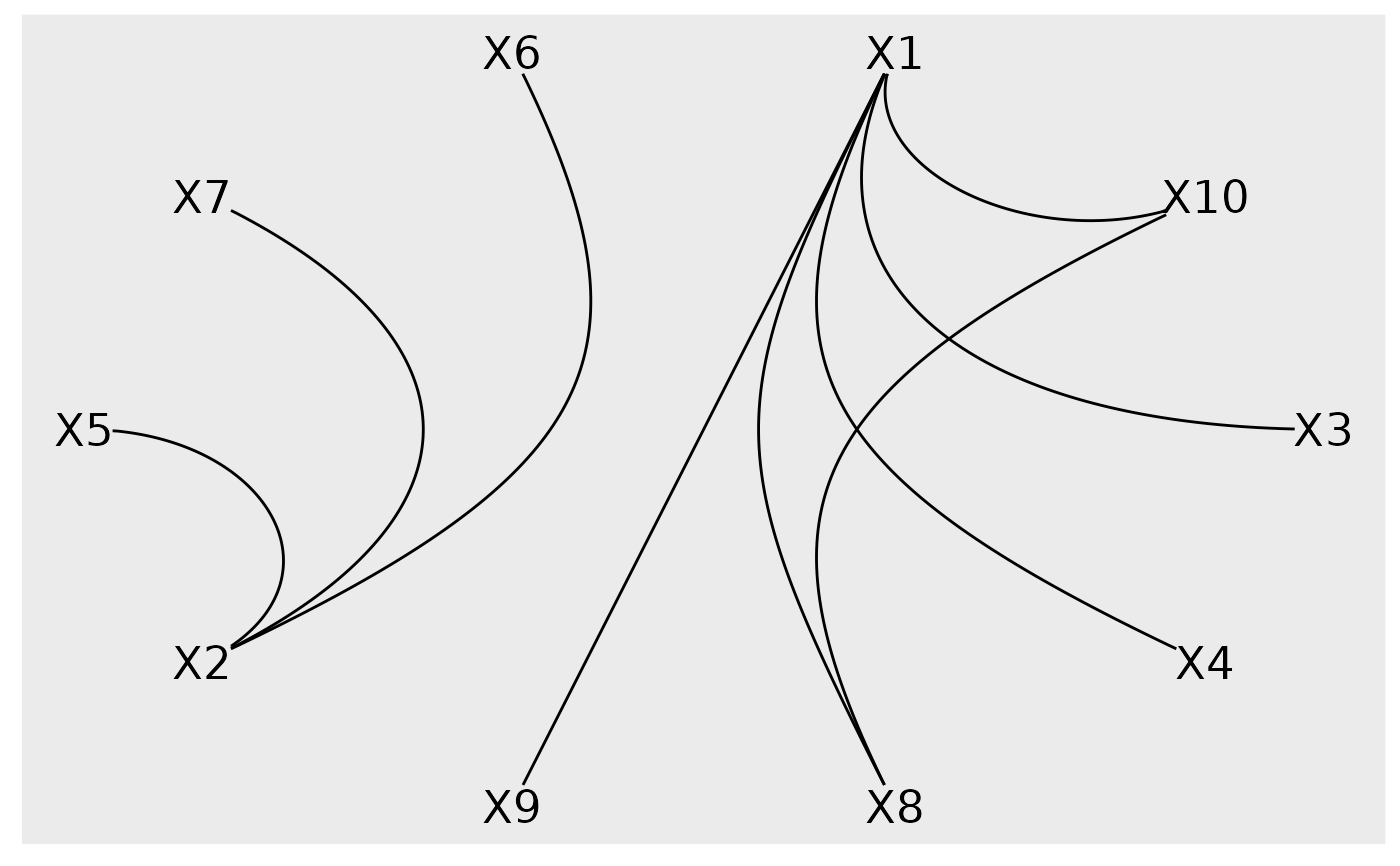
x = c("X1--X10","X1--X3", "X1--X4","X1--X8","X1--X9","X2--X5","X2--X7","X2--X6", "X8--X10")
plot_lratio_network(x, type = "ggraph")
 plot_lratio_network(x, type = "igraph")
#> IGRAPH d9a6554 UN-- 10 9 --
#> + attr: name (v/c)
#> + edges from d9a6554 (vertex names):
#> [1] X1 --X10 X1 --X3 X1 --X4 X1 --X8 X1 --X9 X2 --X5 X2 --X7 X2 --X6
#> [9] X10--X8
plot_lratio_network(x, type = "visNetwork")
#> Loading required namespace: visNetwork
plot_lratio_network(x, type = "igraph")
#> IGRAPH d9a6554 UN-- 10 9 --
#> + attr: name (v/c)
#> + edges from d9a6554 (vertex names):
#> [1] X1 --X10 X1 --X3 X1 --X4 X1 --X8 X1 --X9 X2 --X5 X2 --X7 X2 --X6
#> [9] X10--X8
plot_lratio_network(x, type = "visNetwork")
#> Loading required namespace: visNetwork