Plot cpop coefficients
plot_cpop.RdPlot cpop coefficients
plot_cpop(cpop_result, type = "point", s = "lambda.min")Arguments
- cpop_result
The output of cpop_model
- type
One of "point", "bar", "text" and "ggraph"
- s
lasso s
Examples
data(cpop_data_binary, package = 'CPOP')
## Loading simulated matrices and vectors
x1 = cpop_data_binary$x1
x2 = cpop_data_binary$x2
y1 = cpop_data_binary$y1
y2 = cpop_data_binary$y2
set.seed(1)
cpop_result = cpop_model(x1 = x1, x2 = x2, y1 = y1, y2 = y2, alpha = 1, n_features = 10)
#> Absolute colMeans difference will be used as the weights for CPOP
#> Fitting CPOP model using alpha = 1
#> Based on previous alpha, 0 features are kept
#> CPOP1 - Step 01: Number of selected features: 0 out of 190
#> CPOP1 - Step 02: Number of selected features: 9 out of 190
#> CPOP1 - Step 03: Number of selected features: 16 out of 190
#> 10 features was reached.
#> A total of 16 features were selected.
#> Removing sources of collinearity gives 13 features.
#> 10 features was reached.
#> A total of 13 features were selected.
#> CPOP2 - Sign: Step 01: Number of leftover features: 9 out of 13
#> The sign matrix between the two data:
#>
#> -1 0 1
#> -1 0 0 1
#> 0 0 0 0
#> 1 3 0 0
#> CPOP2 - Sign: Step 02: Number of leftover features: 8 out of 13
#> The sign matrix between the two data:
#>
#> -1 0 1
#> -1 0 0 0
#> 0 0 0 0
#> 1 1 0 0
#> CPOP2 - Sign: Step 03: Number of leftover features: 8 out of 13
#> The sign matrix between the two data:
#>
#> -1 0 1
#> -1 0 0 0
#> 0 0 0 0
#> 1 0 0 0
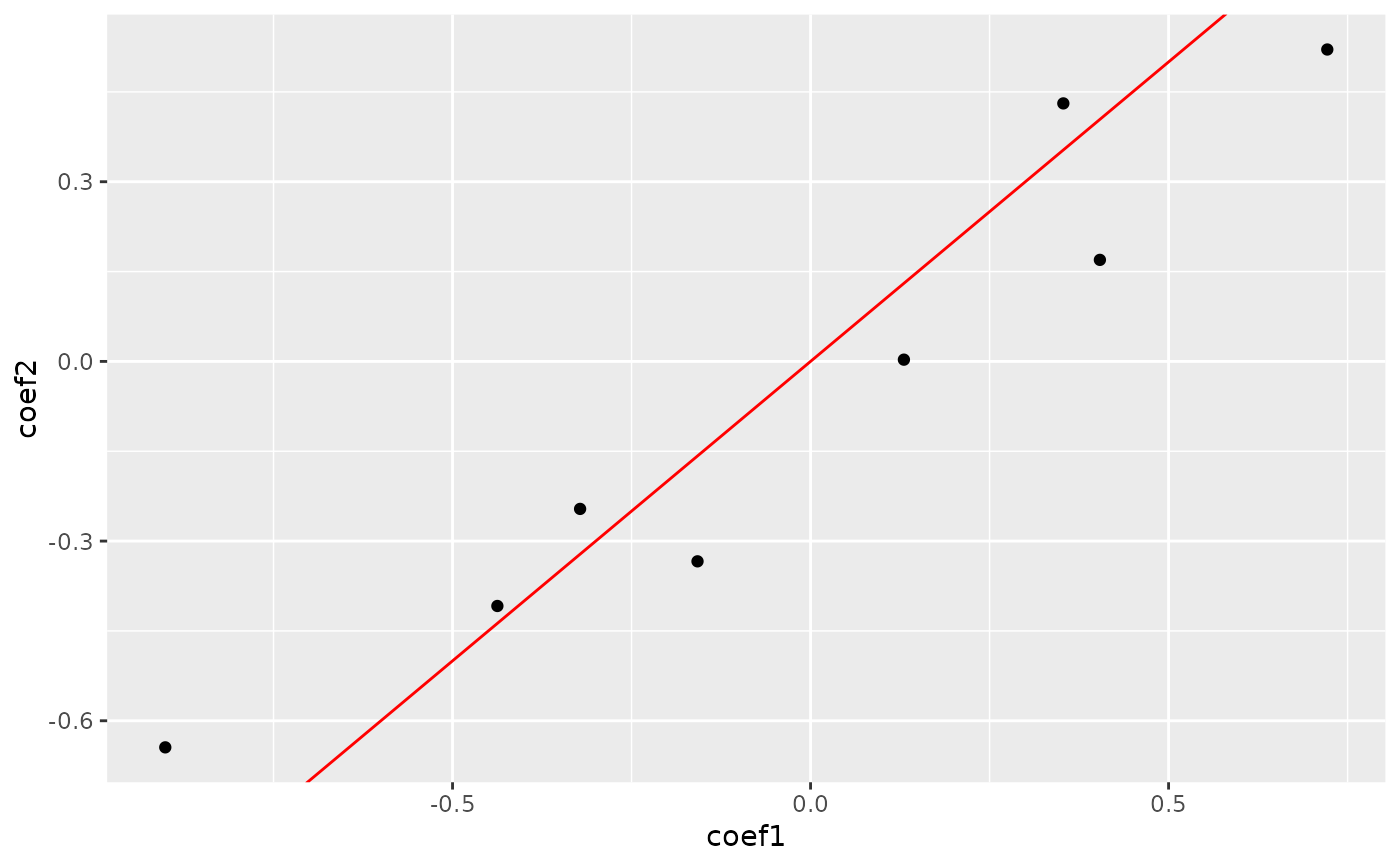
plot_cpop(cpop_result, type = "point")
#> $plot
 #>
#> $data
#> # A tibble: 8 × 3
#> coef_name coef1 coef2
#> <fct> <dbl> <dbl>
#> 1 X01--X10 -0.322 -0.246
#> 2 X09--X17 0.722 0.521
#> 3 X11--X14 0.130 0.00292
#> 4 X12--X20 0.404 0.170
#> 5 X01--X07 -0.437 -0.408
#> 6 X01--X15 -0.158 -0.334
#> 7 X01--X17 -0.901 -0.644
#> 8 X04--X12 0.353 0.431
#>
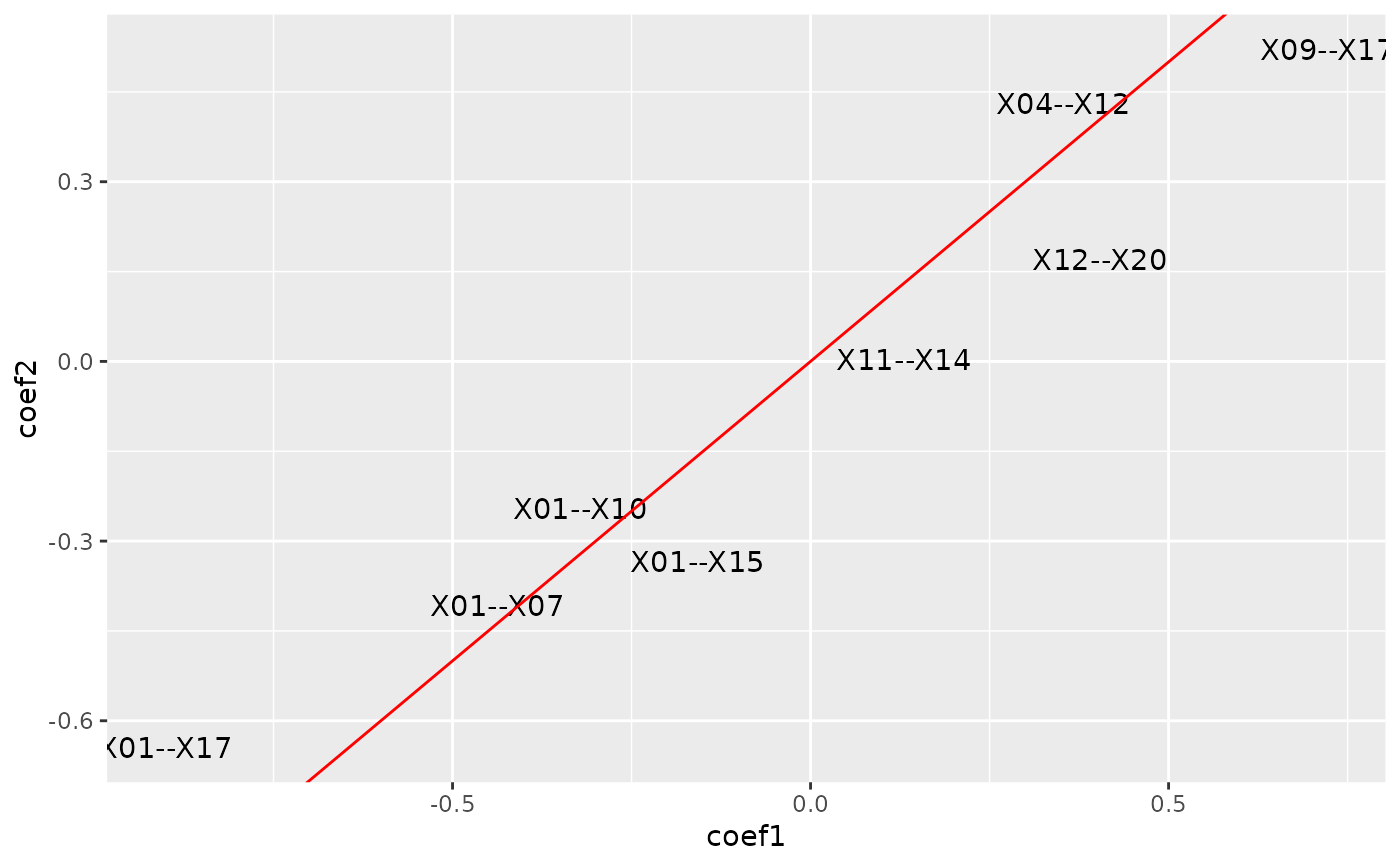
plot_cpop(cpop_result, type = "text")
#> $plot
#>
#> $data
#> # A tibble: 8 × 3
#> coef_name coef1 coef2
#> <fct> <dbl> <dbl>
#> 1 X01--X10 -0.322 -0.246
#> 2 X09--X17 0.722 0.521
#> 3 X11--X14 0.130 0.00292
#> 4 X12--X20 0.404 0.170
#> 5 X01--X07 -0.437 -0.408
#> 6 X01--X15 -0.158 -0.334
#> 7 X01--X17 -0.901 -0.644
#> 8 X04--X12 0.353 0.431
#>
plot_cpop(cpop_result, type = "text")
#> $plot
 #>
#> $data
#> # A tibble: 8 × 3
#> coef_name coef1 coef2
#> <fct> <dbl> <dbl>
#> 1 X01--X10 -0.322 -0.246
#> 2 X09--X17 0.722 0.521
#> 3 X11--X14 0.130 0.00292
#> 4 X12--X20 0.404 0.170
#> 5 X01--X07 -0.437 -0.408
#> 6 X01--X15 -0.158 -0.334
#> 7 X01--X17 -0.901 -0.644
#> 8 X04--X12 0.353 0.431
#>
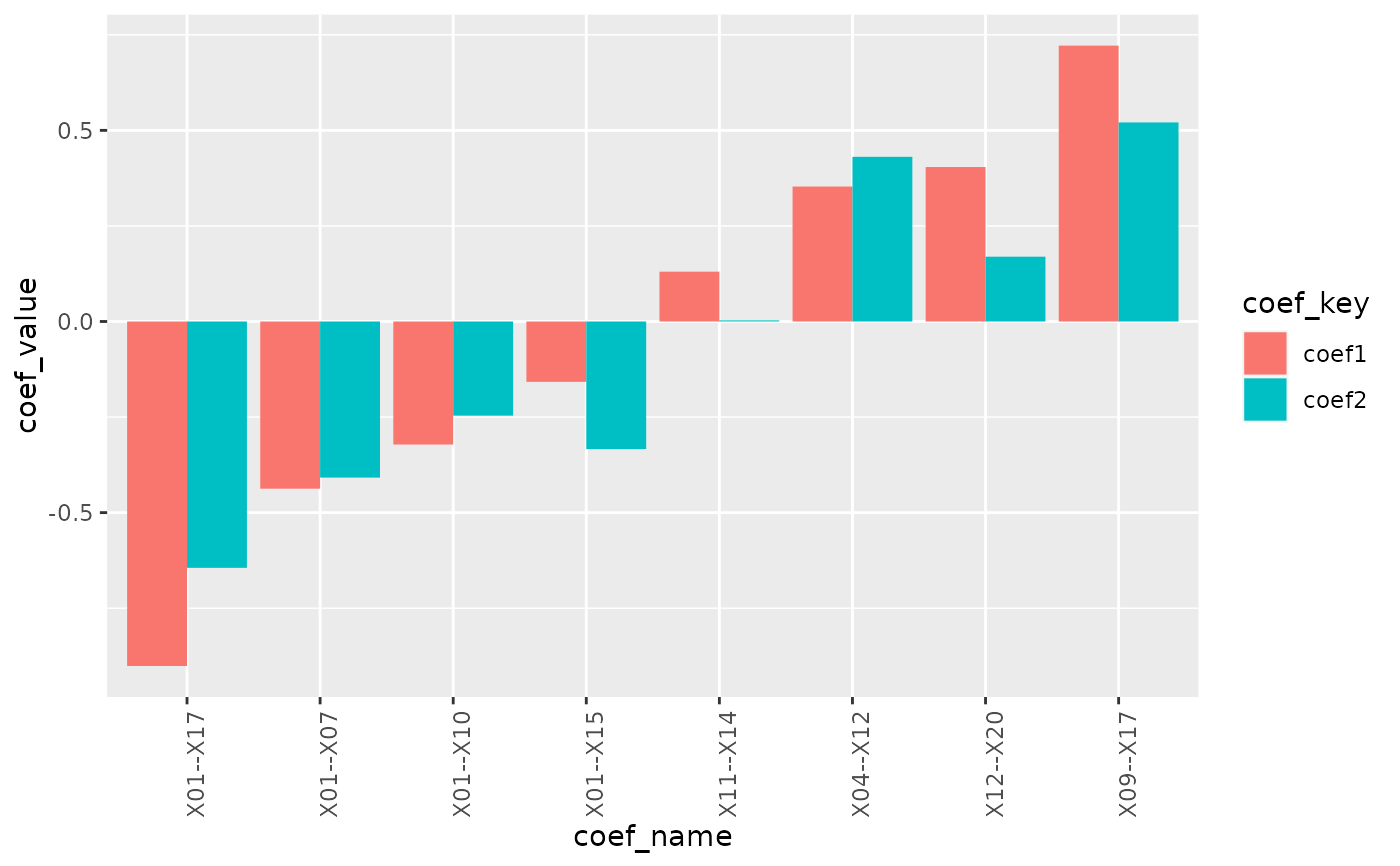
plot_cpop(cpop_result, type = "bar")
#> $plot
#>
#> $data
#> # A tibble: 8 × 3
#> coef_name coef1 coef2
#> <fct> <dbl> <dbl>
#> 1 X01--X10 -0.322 -0.246
#> 2 X09--X17 0.722 0.521
#> 3 X11--X14 0.130 0.00292
#> 4 X12--X20 0.404 0.170
#> 5 X01--X07 -0.437 -0.408
#> 6 X01--X15 -0.158 -0.334
#> 7 X01--X17 -0.901 -0.644
#> 8 X04--X12 0.353 0.431
#>
plot_cpop(cpop_result, type = "bar")
#> $plot
 #>
#> $data
#> # A tibble: 16 × 3
#> coef_name coef_key coef_value
#> <fct> <chr> <dbl>
#> 1 X01--X10 coef1 -0.322
#> 2 X01--X10 coef2 -0.246
#> 3 X09--X17 coef1 0.722
#> 4 X09--X17 coef2 0.521
#> 5 X11--X14 coef1 0.130
#> 6 X11--X14 coef2 0.00292
#> 7 X12--X20 coef1 0.404
#> 8 X12--X20 coef2 0.170
#> 9 X01--X07 coef1 -0.437
#> 10 X01--X07 coef2 -0.408
#> 11 X01--X15 coef1 -0.158
#> 12 X01--X15 coef2 -0.334
#> 13 X01--X17 coef1 -0.901
#> 14 X01--X17 coef2 -0.644
#> 15 X04--X12 coef1 0.353
#> 16 X04--X12 coef2 0.431
#>
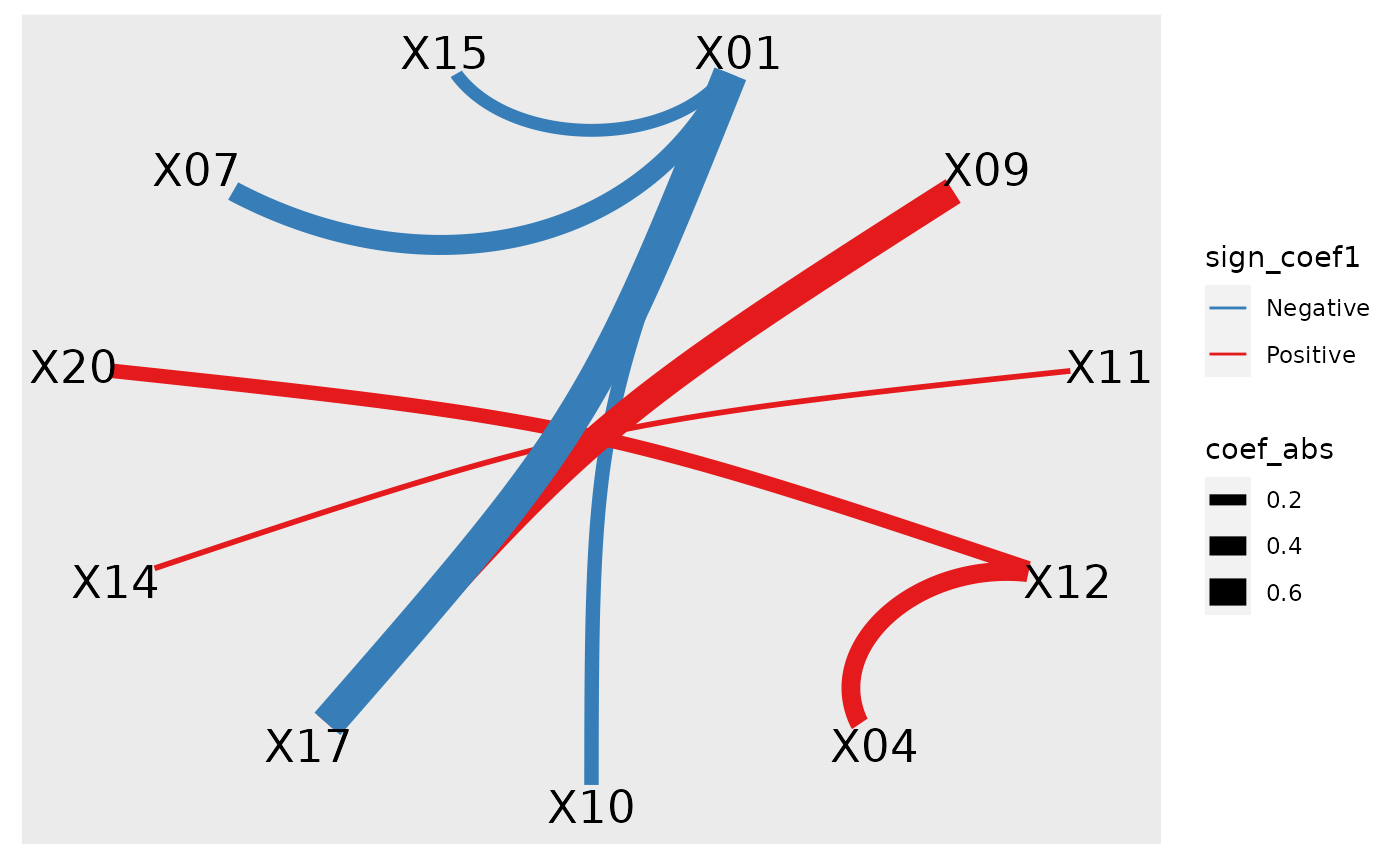
plot_cpop(cpop_result, type = "ggraph")
#> $plot
#>
#> $data
#> # A tibble: 16 × 3
#> coef_name coef_key coef_value
#> <fct> <chr> <dbl>
#> 1 X01--X10 coef1 -0.322
#> 2 X01--X10 coef2 -0.246
#> 3 X09--X17 coef1 0.722
#> 4 X09--X17 coef2 0.521
#> 5 X11--X14 coef1 0.130
#> 6 X11--X14 coef2 0.00292
#> 7 X12--X20 coef1 0.404
#> 8 X12--X20 coef2 0.170
#> 9 X01--X07 coef1 -0.437
#> 10 X01--X07 coef2 -0.408
#> 11 X01--X15 coef1 -0.158
#> 12 X01--X15 coef2 -0.334
#> 13 X01--X17 coef1 -0.901
#> 14 X01--X17 coef2 -0.644
#> 15 X04--X12 coef1 0.353
#> 16 X04--X12 coef2 0.431
#>
plot_cpop(cpop_result, type = "ggraph")
#> $plot
 #>
#> $data
#> # A tibble: 8 × 7
#> from to coef1 coef2 coef_avg coef_abs sign_coef1
#> <chr> <chr> <dbl> <dbl> <dbl> <dbl> <chr>
#> 1 X01 X10 -0.322 -0.246 -0.284 0.284 Negative
#> 2 X09 X17 0.722 0.521 0.621 0.621 Positive
#> 3 X11 X14 0.130 0.00292 0.0666 0.0666 Positive
#> 4 X12 X20 0.404 0.170 0.287 0.287 Positive
#> 5 X01 X07 -0.437 -0.408 -0.423 0.423 Negative
#> 6 X01 X15 -0.158 -0.334 -0.246 0.246 Negative
#> 7 X01 X17 -0.901 -0.644 -0.773 0.773 Negative
#> 8 X04 X12 0.353 0.431 0.392 0.392 Positive
#>
#>
#> $data
#> # A tibble: 8 × 7
#> from to coef1 coef2 coef_avg coef_abs sign_coef1
#> <chr> <chr> <dbl> <dbl> <dbl> <dbl> <chr>
#> 1 X01 X10 -0.322 -0.246 -0.284 0.284 Negative
#> 2 X09 X17 0.722 0.521 0.621 0.621 Positive
#> 3 X11 X14 0.130 0.00292 0.0666 0.0666 Positive
#> 4 X12 X20 0.404 0.170 0.287 0.287 Positive
#> 5 X01 X07 -0.437 -0.408 -0.423 0.423 Negative
#> 6 X01 X15 -0.158 -0.334 -0.246 0.246 Negative
#> 7 X01 X17 -0.901 -0.644 -0.773 0.773 Negative
#> 8 X04 X12 0.353 0.431 0.392 0.392 Positive
#>