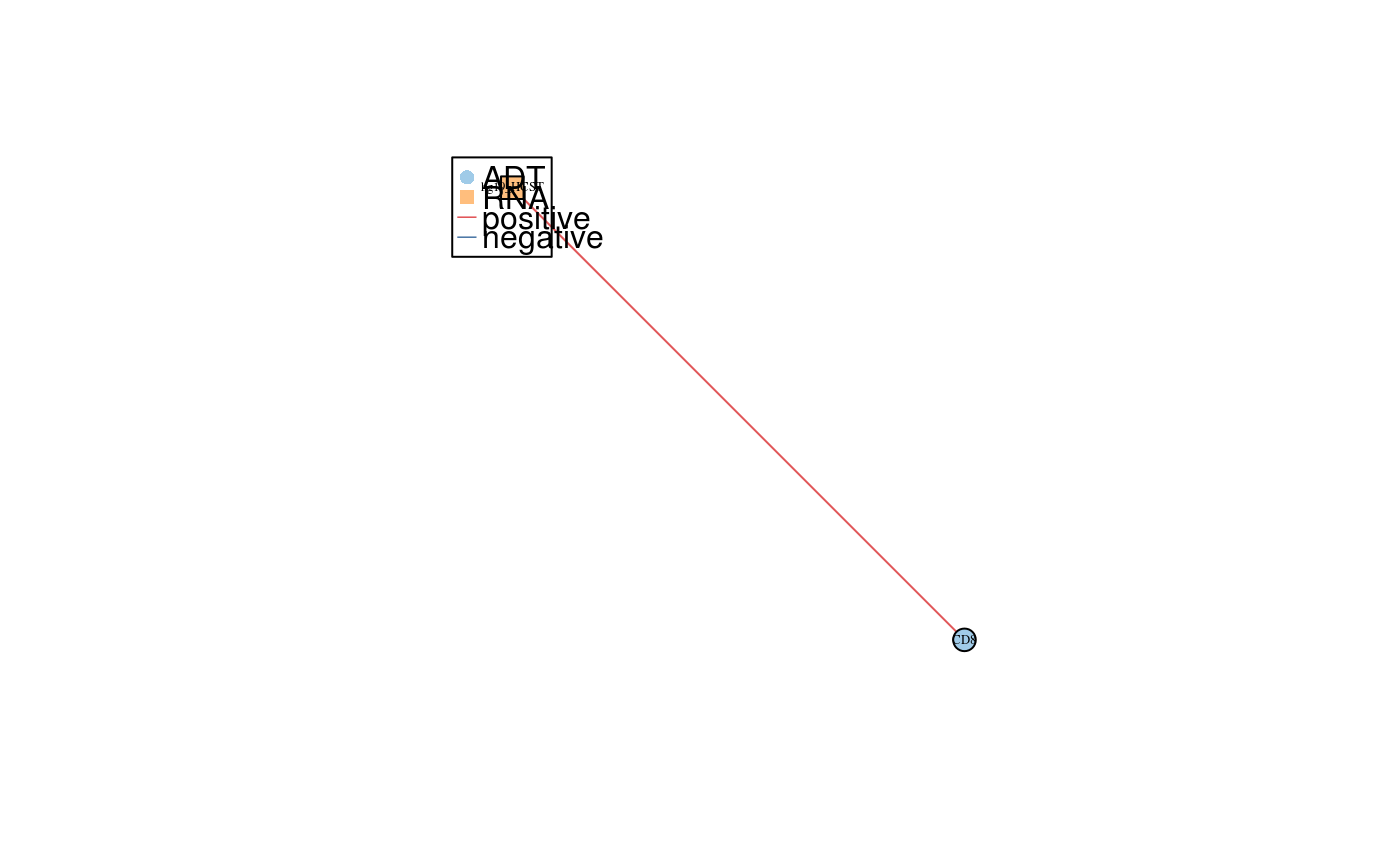
A function to visualise the features distribtuion
geneADTnetwork(
  sce,
  RNA_exprs_value = "logcounts",
  altExp_name = "ADT",
  altExp_exprs_value = "logcounts",
  RNA_feature_subset = NULL,
  ADT_feature_subset = NULL,
  cell_subset = NULL,
  cor_threshold = 0.5,
  cor_method = c("pearson", "kendall", "spearman"),
  RNA_exprs_pct = 0.1,
  ADT_exprs_pct = 0.1,
  RNA_exprs_threshold = 0,
  ADT_exprs_threshold = 0,
  network_layout = NULL,
  return_igraph = FALSE
)
Arguments
| sce | A singlecellexperiment object |
|---|---|
| RNA_exprs_value | A character indicates which expression value for RNA in assayNames is used. |
| altExp_name | A character indicates which expression matrix is used. by default is none (i.e. RNA). |
| altExp_exprs_value | A character indicates which expression value in assayNames is used. |
| RNA_feature_subset | A vector of characters indicates the subset of features of RNA that are used for visualisation |
| ADT_feature_subset | A vector of characters indicates the subset of features of ADT that are used for visualisation |
| cell_subset | A vector of characters indicates the subset of cells that are used for visualisation |
| cor_threshold | Thresholds of correlation. |
| cor_method | a character string indicating which correlation coefficient (or covariance) is to be computed. One of "pearson" (default), "kendall", or "spearman": can be abbreviated. |
| RNA_exprs_pct | A numeric indicates the threshold expression percentage of a gene to be considered in correlation analysis |
| ADT_exprs_pct | A numeric indicates the threshold expression percentage of a gene to be considered in correlation analysis |
| RNA_exprs_threshold | A numeric indicates the threshold of RNA expression. By default is 0. |
| ADT_exprs_threshold | A numeric indicates the threshold of ADT expression. By default is 0. |
| network_layout | layout of the network |
| return_igraph | indicates whether return the igraph object |
Value
A igraph object of gene-ADT network
Examples
library(SingleCellExperiment)#>#>#>#>#>#> #> #> #> #>#>#>#> #>#> #> #>#> #>#> #> #>#> #> #>set.seed(2020) data(sce_control_subset, package = "CiteFuse") RNA_feature_subset <- sample(rownames(sce_control_subset), 50) ADT_feature_subset <- rownames(altExp(sce_control_subset, "ADT")) geneADTnetwork(sce_control_subset, RNA_feature_subset = RNA_feature_subset, ADT_feature_subset = ADT_feature_subset, cor_method = "pearson", network_layout = igraph::layout_with_fr)#> IGRAPH ff83359 UN-B 2 1 -- #> + attr: name (v/c), label (v/c), class (v/c), type (v/l), shape (v/c), #> | color (v/c), size (v/n), label.cex (v/n), label.color (v/c), value #> | (e/n), color (e/c), weights (e/n) #> + edge from ff83359 (vertex names): #> [1] RNA_hg19_HCST--ADT_CD8