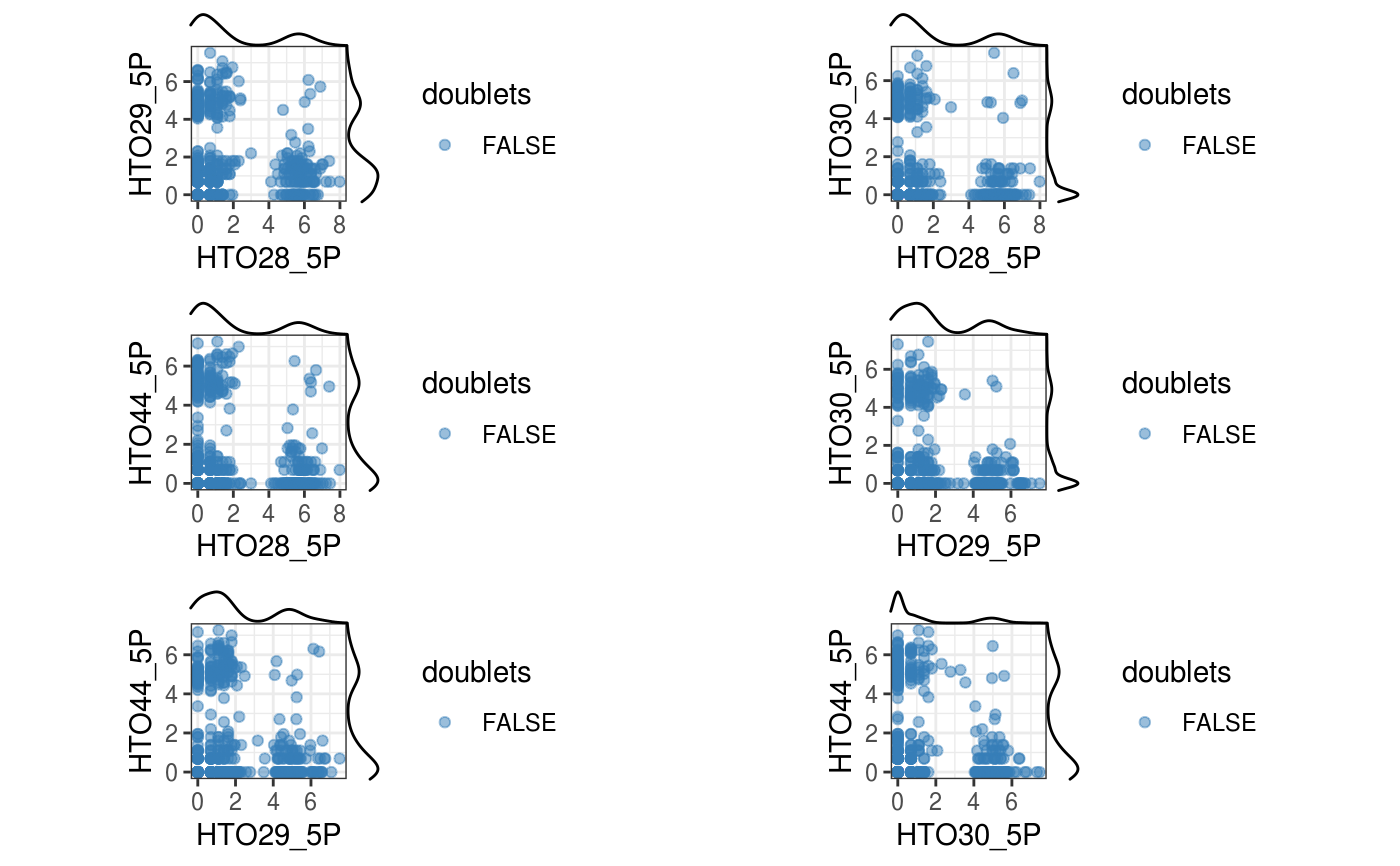
A function to plot HTO expression
plotHTO(sce, which_idx = seq_len(2), altExp_name = NULL, ncol = 2)
Arguments
| sce | sce |
|---|---|
| which_idx | which_idx |
| altExp_name | altExp_name |
| ncol | ncol |
Value
A plot visualising the HTO expression
Examples
data(CITEseq_example, package = "CiteFuse")
sce_citeseq <- preprocessing(CITEseq_example)
sce_citeseq <- normaliseExprs(sce = sce_citeseq,
altExp_name = "HTO",
transform = "log")
plotHTO(sce_citeseq, 1:4)#> Warning: Haven't performed doubletClassify() yet!#> Warning: Haven't performed doubletClassify() yet!#> Warning: Haven't performed doubletClassify() yet!#> Warning: Haven't performed doubletClassify() yet!#> Warning: Haven't performed doubletClassify() yet!#> Warning: Haven't performed doubletClassify() yet!