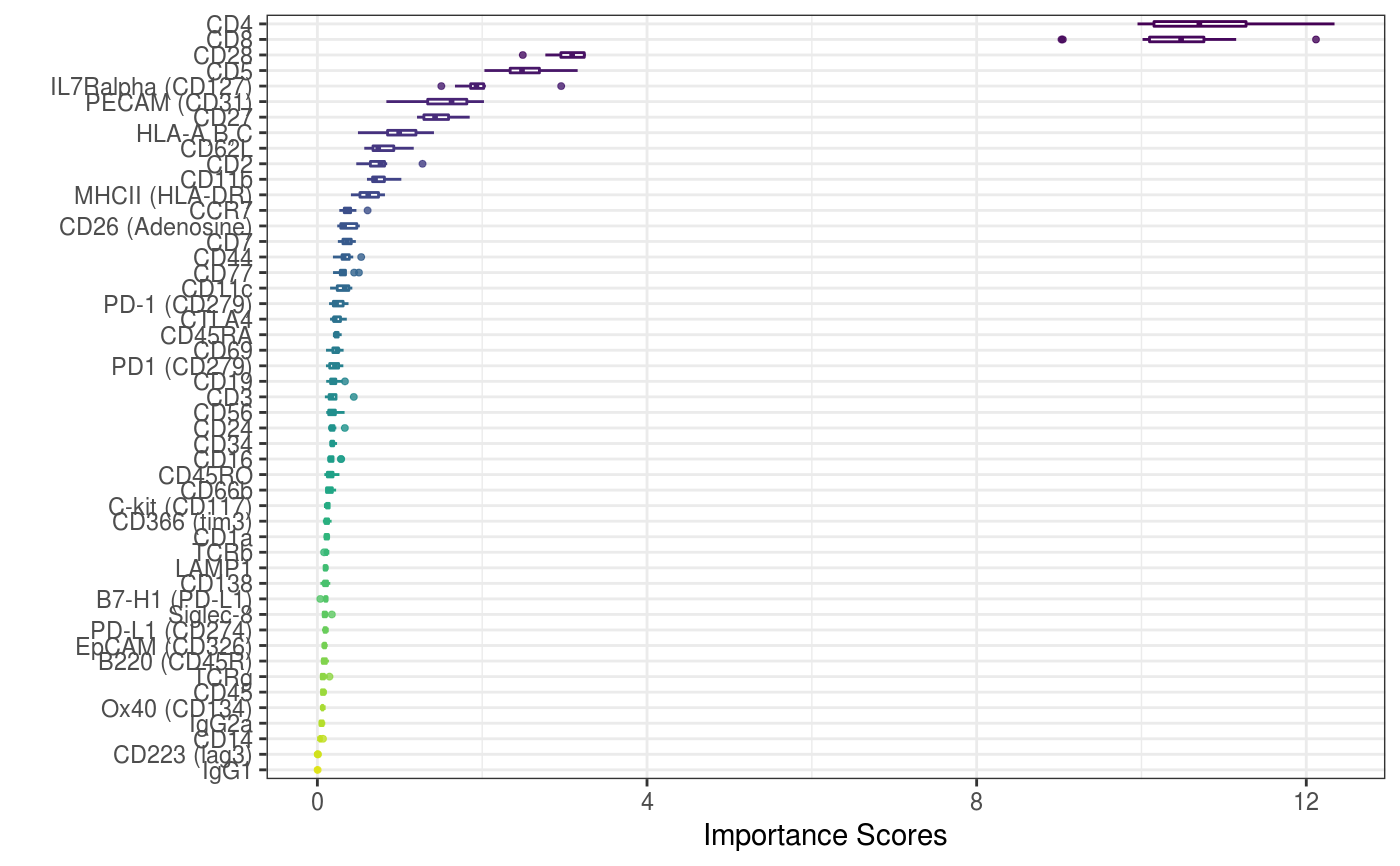
A function to visualise the features distribtuion
visImportance(
  sce,
  plot = c("boxplot", "heatmap"),
  altExp_name = "ADT",
  exprs_value = "logcounts"
)
Arguments
| sce | A singlecellexperiment object |
|---|---|
| plot | A string indicates the type of the plot (either boxplot or heatmap) |
| altExp_name | A character indicates which expression matrix is used. by default is none (i.e. RNA). |
| exprs_value | A character indicates which expression value in assayNames is used. |
Value
A plot (either ggplot or pheatmap) to visualise the ADT importance results
Examples
data("sce_control_subset", package = "CiteFuse")
sce_control_subset <- importanceADT(sce_control_subset,
group = sce_control_subset$SNF_W_louvain,
subsample = TRUE)
visImportance(sce_control_subset, plot = "boxplot")#> Warning: Use of `df_toPlot$features` is discouraged. Use `features` instead.#> Warning: Use of `df_toPlot$importance` is discouraged. Use `importance` instead.#> Warning: Use of `df_toPlot$features` is discouraged. Use `features` instead.