A function to visualise the reduced dimension
visualiseDim(
  sce,
  dimNames = NULL,
  colour_by = NULL,
  shape_by = NULL,
  data_from = c("colData", "assay", "altExp"),
  assay_name = NULL,
  altExp_name = NULL,
  altExp_assay_name = NULL,
  dim = seq_len(2)
)
Arguments
| sce | A singlecellexperiment object |
|---|---|
| dimNames | indicates the name of the reduced dimension results. |
| colour_by | A character indicates how the cells coloured by. The information either stored in colData, assay, or altExp. |
| shape_by | A character indicates how the cells shaped by. The information either stored in colData, assay, or altExp. |
| data_from | A character indicates where the colour by data stored |
| assay_name | A character indicates the assay name of the expression |
| altExp_name | A character indicates the name of alternative expression |
| altExp_assay_name | A character indicates the assay name of alternative expression |
| dim | a vector of numeric with length of 2 indicates which component is being plot |
Value
A ggplot of the reduced dimension visualisation
Examples
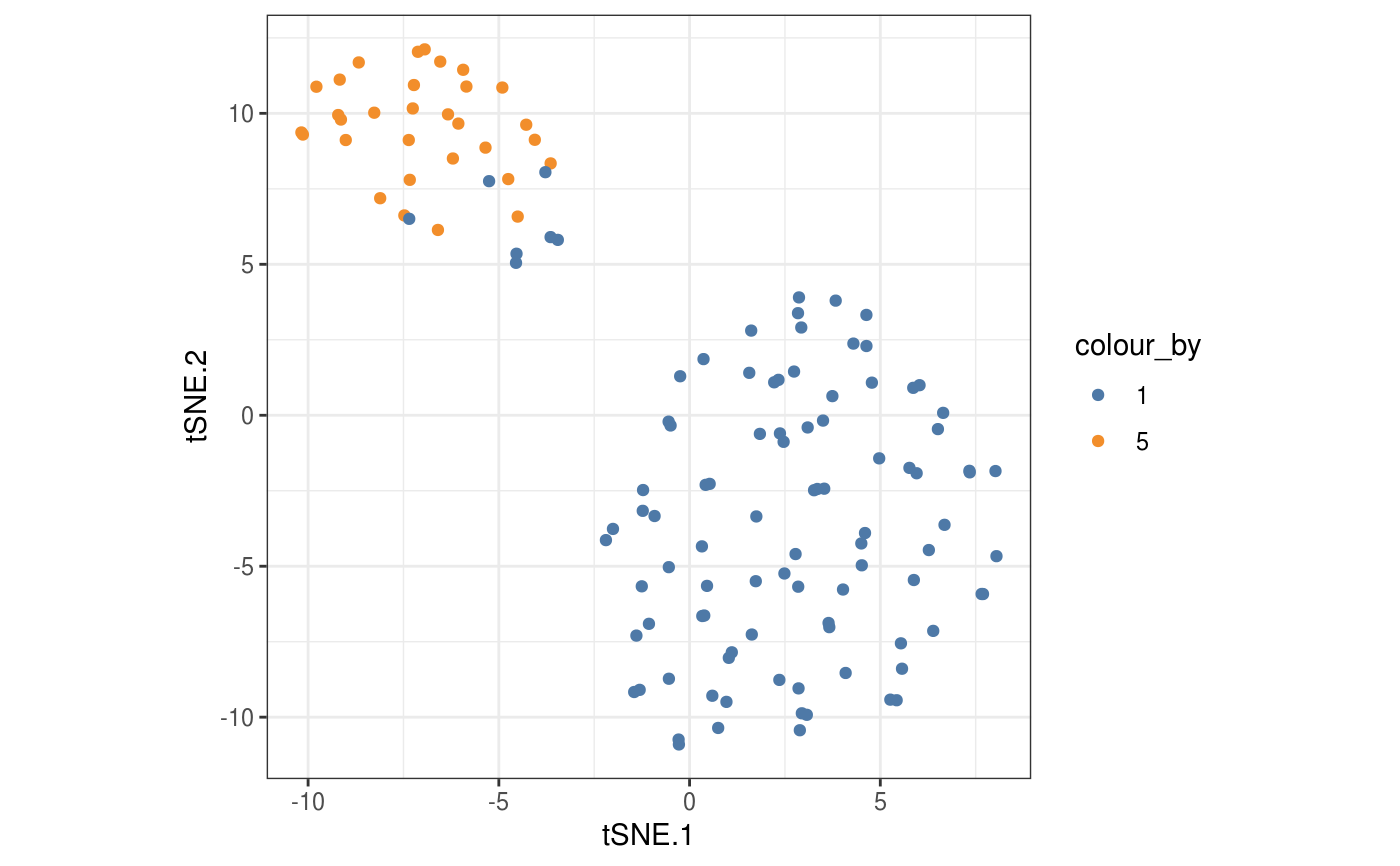
#> Calculating affinity matrix #> Performing SNFsce_control_subset <- reducedDimSNF(sce_control_subset, method = "tSNE", dimNames = "tSNE_joint") visualiseDim(sce_control_subset, dimNames = "tSNE_joint", colour_by = "SNF_W_clust")