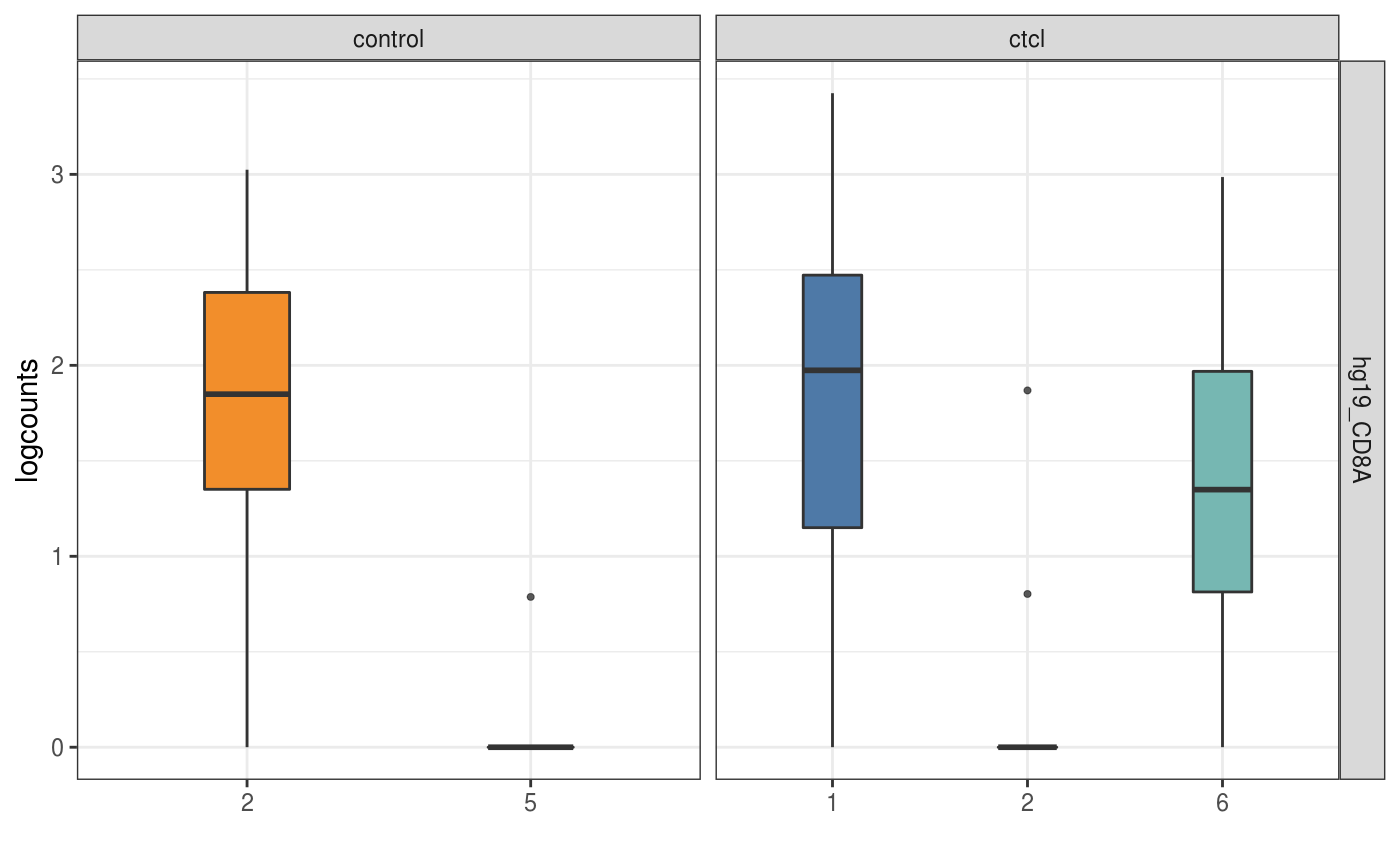
A function to visualise the features distribtuion for a list of SingleCellExperiment
visualiseExprsList(
  sce_list,
  plot = c("boxplot", "violin", "jitter", "density"),
  altExp_name = "none",
  exprs_value = "logcounts",
  group_by = NULL,
  feature_subset = NULL,
  cell_subset = NULL,
  n = NULL
)
Arguments
| sce_list | A list of SingleCellExperiment object |
|---|---|
| plot | Type of plot, includes boxplot, violin, jitter, density, and pairwise. By default is boxplot |
| altExp_name | A character indicates which expression matrix is used. by default is none (i.e. RNA). |
| exprs_value | A character indicates which expression value in assayNames is used. |
| group_by | A character indicates how is the expression will be group in the plots (stored in colData). |
| feature_subset | A vector of characters indicates the subset of features that are used for visualisation |
| cell_subset | A vector of characters indicates the subset of cells that are used for visualisation |
| n | A numeric indicates the top expressed features to show. |
Value
A ggplot to visualise te features distribution
Examples
data(sce_control_subset, package = "CiteFuse")
data(sce_ctcl_subset, package = "CiteFuse")
visualiseExprsList(sce_list = list(control = sce_control_subset,
ctcl = sce_ctcl_subset),
plot = "boxplot",
altExp_name = "none",
exprs_value = "logcounts",
feature_subset = c("hg19_CD8A"),
group_by = c("SNF_W_louvain", "SNF_W_louvain"))