A function to perform louvain clustering
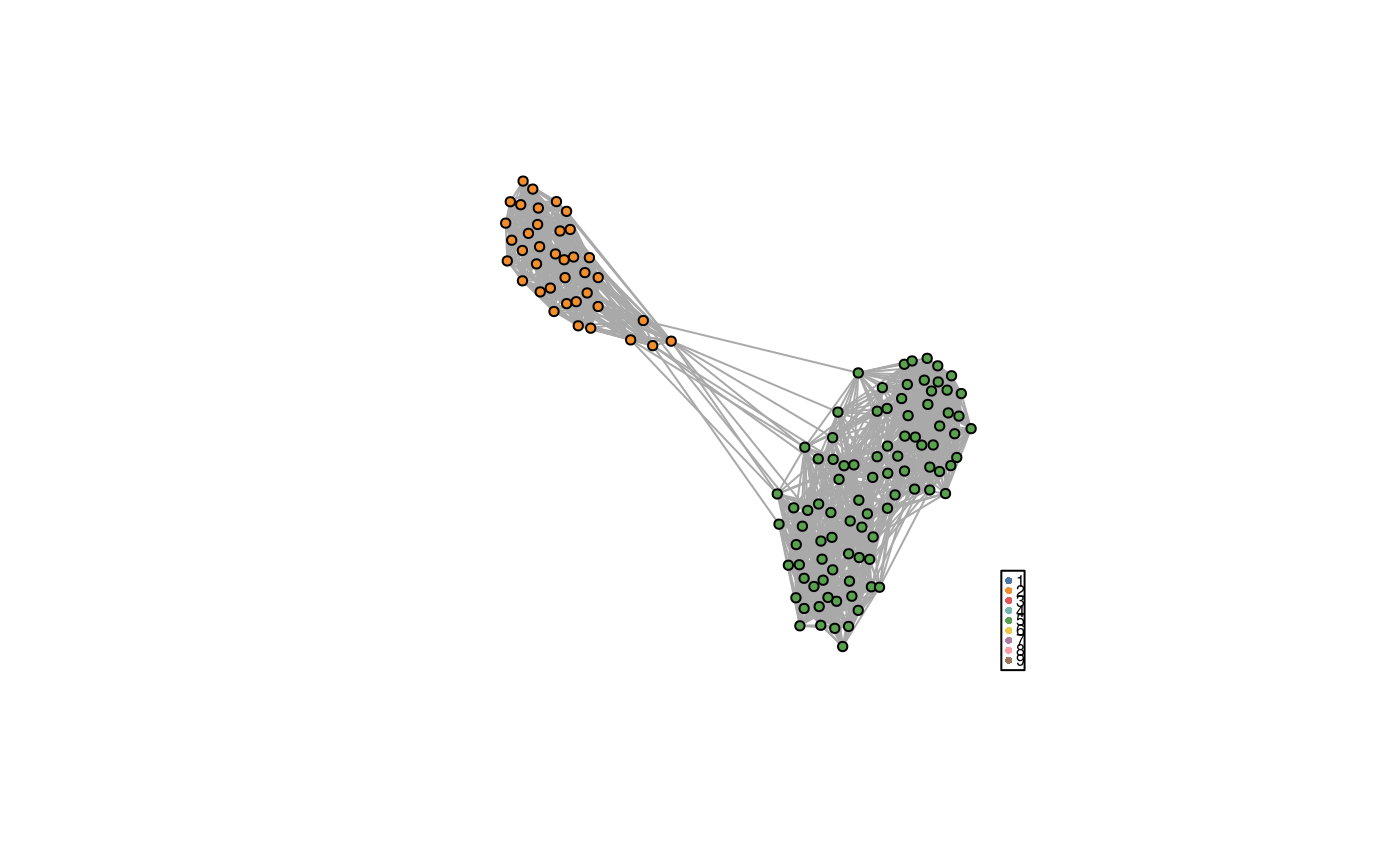
visualiseKNN(sce, colour_by = NULL, metadata = "SNF_W")
Arguments
| sce | A singlecellexperiment object |
|---|---|
| colour_by | the name of coldata that is used to colour the node |
| metadata | indicates the meta data name of affinity matrix to virsualise |
Value
A igraph plot
Examples
#> Calculating affinity matrix #> Performing SNFSNF_W_louvain <- igraphClustering(sce_control_subset, method = "louvain") visualiseKNN(sce_control_subset, colour_by = "SNF_W_louvain")