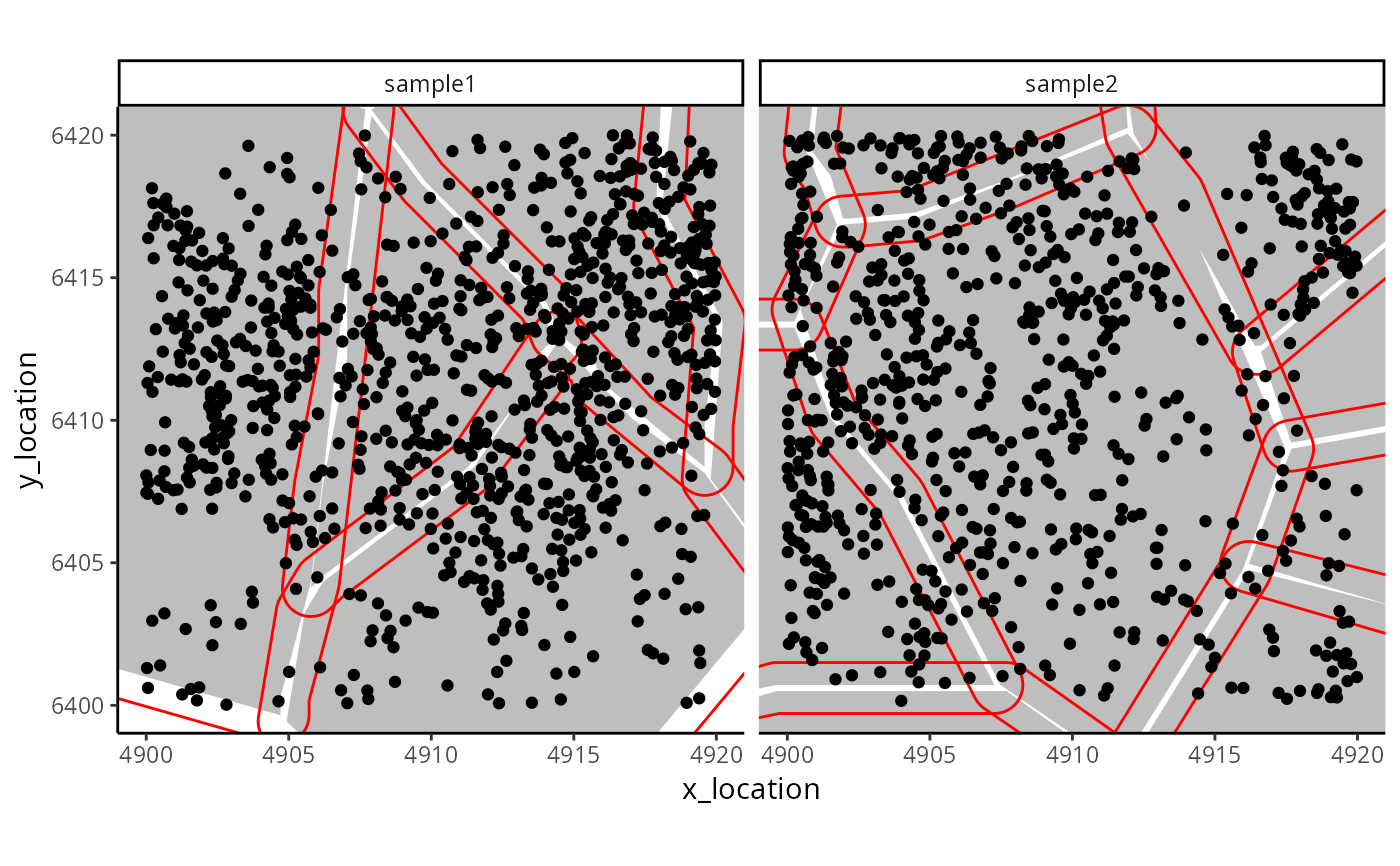
This function takes in an existing MoleculeExperiment object and generates a new boundaries assay with added buffers. This can be useful for visualisation and for countMolecules.
Arguments
- me
A MoleculeExperiment object.
- assayName
Character string (default "cell") specifying the existing boundaries assay that should have buffer added.
- ...
Arguments that pass to internal functions. The most relevant parameter is buffer (default 0).
Examples
repoDir <- system.file("extdata", package = "MoleculeExperiment")
repoDir <- paste0(repoDir, "/xenium_V1_FF_Mouse_Brain")
me <- readXenium(repoDir,
  keepCols = "essential"
)
MoleculeExperiment::boundaries(me, "cell_buffer") <- bufferBoundaries(
  me,
  assayName = "cell", buffer = 1
)

library(ggplot2)
ggplot_me() +
  geom_polygon_me(me, assayName = "cell", fill = "grey") +
  geom_polygon_me(me, assayName = "cell_buffer", fill = NA, colour = "red") +
  geom_point_me(me) +
  coord_cartesian(
    xlim = c(4900, 4919.98),
    ylim = c(6400.02, 6420)
  )
