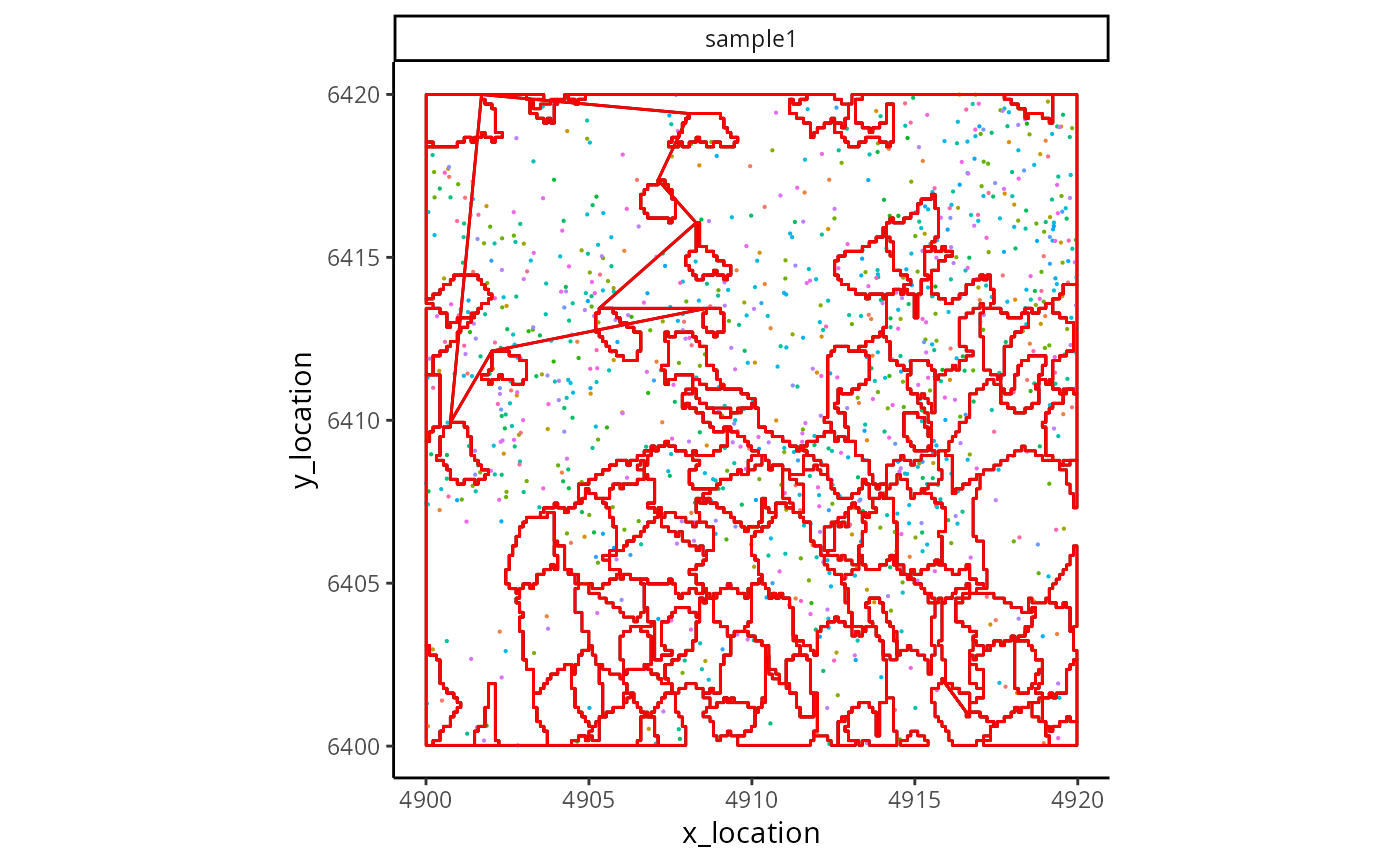
Reads a segmentation mask TIFF and transforms it into a ME boundaries object. One must provide either the path or the loaded image object.
Usage
readSegMask(
  extent,
  path = NULL,
  image = NULL,
  assayName = "cell",
  background_value = NULL,
  sample_id = NULL
)
Arguments
- extent
The extent of the loaded segmentation mask in micrometers. Used to align the mask with the transcripts. This must be of the form c(xmin, xmax, ymin, ymax).
- path
The path of the segmenation mask, Default: NULL
- image
The loaded image object, Default: NULL
- assayName
The name of the segmentation (e.g. cell, or nucleus), Default: 'cell'
- background_value
The value corresponding to the background in the segmentation, Default: NULL
- sample_id
What the sample should be named, Default: NULL
Examples
repoDir <- system.file("extdata", package = "MoleculeExperiment")
segMask <- paste0(repoDir, "/BIDcell_segmask.tif")
data <- paste0(repoDir, "/xenium_V1_FF_Mouse_Brain/sample1")
me <- readXenium(data,
    keepCols = "essential",
    addBoundaries = NULL
)
boundaries(me, "BIDcell_segmentation") <- readSegMask(
    # use the molecule extent to define the boundary extent
    extent(me, assayName = "detected"),
    path = segMask, assayName = "BIDcell_segmentation",
    sample_id = "sample1", background_value = 0
)
ggplot_me() +
    geom_polygon_me(
        me,
        assayName = "BIDcell_segmentation", fill = NA, colour = "black"
    ) +
    geom_point_me(me, byColour = "feature_id", size = 0.1) +
    geom_polygon_me(
        me,
        assayName = "BIDcell_segmentation", fill = NA, colour = "red"
    )
