cytoGateR Python: complete workflow using the R demo data#
This notebook loads cytoGateR/data/cytoGateR_example.rda, exports one complete image from its R SpatialExperiment, converts it to Python AnnData, and runs gating, supervised prediction, uncertainty analysis, and plotting.
from pathlib import Path
import subprocess
import tempfile

import anndata as ad
import matplotlib.pyplot as plt
import numpy as np
import pandas as pd
import cytogater as cg
from cytogater.models.knn import train_custom_knn, predict_unknown_with_knn
from cytogater.models.random_forest import train_custom_randomforest, predict_unknown_with_randomforest
from cytogater.uncertainty import calculate_uncertainty, calculate_spatial_prior_labels
from cytogater.plotting import (
    plot_labelled_cells, plot_probability_map, plot_marker_density,
    plot_confusion_matrix, plot_class_metrics, plot_celltype_tree,
)

plt.rcParams['figure.dpi'] = 110
pd.set_option('display.max_rows', 30)
SAVE_OUTPUT = False  # Set True to write the final .h5ad file.
1. Convert the packaged R SpatialExperiment to AnnData#
The conversion cell calls the repository’s R installation, selects the first complete image, and exports expression, cell metadata, and spatial coordinates. No additional R package is required beyond the packages already used by cytoGateR.
def find_cytogater_root():
    candidates = [Path.cwd(), *Path.cwd().parents]
    for path in candidates:
        if (path / 'data' / 'cytoGateR_example.rda').exists():
            return path
        if (path / 'cytoGateR' / 'data' / 'cytoGateR_example.rda').exists():
            return path / 'cytoGateR'
    raise FileNotFoundError('Run this notebook from the cytoGateR repository.')

r_package_root = find_cytogater_root()
conversion_dir = Path(tempfile.mkdtemp(prefix='cytogater-r-demo-'))
r_code = r'''
args <- commandArgs(trailingOnly = TRUE)
load(args[1])
suppressPackageStartupMessages(library(SpatialExperiment))
image_ids <- as.character(colData(cytoGateR_example)$image_name)
spe <- cytoGateR_example[, image_ids == unique(image_ids)[1]]
expr <- t(as.matrix(assay(spe, "exprs")))
meta <- as.data.frame(colData(spe))
meta[] <- lapply(meta, function(x) if (is.factor(x)) as.character(x) else x)
coords <- as.data.frame(spatialCoords(spe))
write.csv(expr, file.path(args[2], "expression.csv"), quote = FALSE)
write.csv(meta, file.path(args[2], "obs.csv"), quote = TRUE)
write.csv(coords, file.path(args[2], "spatial.csv"), quote = FALSE)
'''
subprocess.run([
    'Rscript', '-e', r_code,
    str(r_package_root / 'data' / 'cytoGateR_example.rda'),
    str(conversion_dir),
], check=True)

expression = pd.read_csv(conversion_dir / 'expression.csv', index_col=0)
obs = pd.read_csv(conversion_dir / 'obs.csv', index_col=0)
spatial = pd.read_csv(conversion_dir / 'spatial.csv', index_col=0).to_numpy()
obs.index = expression.index.astype(str)

adata = ad.AnnData(expression.to_numpy(dtype=float), obs=obs)
adata.obs_names = expression.index.astype(str)
adata.var_names = expression.columns.astype(str)
adata.layers['exprs'] = adata.X.copy()
adata.obsm['spatial'] = spatial
adata
AnnData object with n_obs × n_vars = 4363 × 40
    obs: 'sample_id', 'image_name', 'cell_type', 'cell_type_hard', 'prob_best', 'core_group', 'knn_label', 'knn_confidence', 'P_Tumor', 'P_Stroma', 'P_Myeloid', 'P_Neutrophil', 'P_Bcell', 'P_Plasma_cell', 'P_BnTcell', 'P_CD8', 'P_CD4', 'P_Treg', 'KNN_P_Bcell', 'KNN_P_BnTcell', 'KNN_P_CD4', 'KNN_P_CD8', 'KNN_P_Myeloid', 'KNN_P_Neutrophil', 'KNN_P_Plasma_cell', 'KNN_P_Stroma', 'KNN_P_Treg', 'KNN_P_Tumor'
    obsm: 'spatial'
    layers: None (.X), 'exprs'
print(f'{adata.n_obs:,} cells × {adata.n_vars} markers')
display(adata.obs[['sample_id', 'image_name', 'cell_type']].head())
display(pd.Series(adata.var_names, name='marker').to_frame().T)
4,363 cells × 40 markers
| sample_id | image_name | cell_type | |
|---|---|---|---|
| 12_1 | Patient4_006 | Patient4_006 | CD8 |
| 12_2 | Patient4_006 | Patient4_006 | Bcell |
| 12_3 | Patient4_006 | Patient4_006 | BnTcell |
| 12_4 | Patient4_006 | Patient4_006 | BnTcell |
| 12_5 | Patient4_006 | Patient4_006 | BnTcell |
| 0 | 1 | 2 | 3 | 4 | 5 | 6 | 7 | 8 | 9 | ... | 30 | 31 | 32 | 33 | 34 | 35 | 36 | 37 | 38 | 39 | |
|---|---|---|---|---|---|---|---|---|---|---|---|---|---|---|---|---|---|---|---|---|---|
| marker | MPO | H3 | SMA | CD16 | CD38 | HLA_DR | CD27 | CD15 | CD45RA | CD163 | ... | VISTA | CD40 | CD4 | CD14 | CDH1 | CD303 | CD206 | c_PARP | DNA1 | DNA2 |
1 rows × 40 columns
2. Define the marker lineage table#
This is the public lineage table used in the R Basic_Pipeline.qmd vignette.
lineage_table = pd.DataFrame({
    'cell_type': ['Tumor', 'Stroma', 'Myeloid', 'Neutrophil', 'Bcell', 'Plasma_cell', 'BnTcell', 'CD8', 'CD4', 'Treg'],
    'pos_markers': [
        ['CDH1', 'CA9', 'PD_L1'], ['SMA', 'PDGFRB'],
        ['CD68', 'CD163', 'CD14', 'CD11c', 'CD33', 'CD206', 'CD303', 'HLA_DR', 'IDO1', 'VISTA', 'CD40'],
        ['MPO', 'CD15', 'CD16'], ['CD20', 'CD40', 'HLA_DR', 'B2M'], ['CD38', 'CD27'],
        ['CD3e', 'CD20', 'CD7', 'B2M'], ['CD3e', 'CD8a', 'GZMB', 'TCF7'],
        ['CD3e', 'CD4'], ['CD3e', 'CD4', 'FOXP3', 'ICOS'],
    ],
    'neg_markers': [
        ['CD3e', 'CD20', 'SMA', 'CD68'], ['CDH1', 'CD3e', 'CD20', 'MPO'],
        ['CD3e', 'CD20', 'CDH1'], ['CD3e', 'CD20'], ['CD3e', 'MPO', 'CDH1'],
        ['CD20', 'CD3e', 'CD4'], ['CDH1', 'SMA', 'MPO'], ['CD4', 'FOXP3', 'CD20'],
        ['CD8a', 'FOXP3', 'CD20'], ['CD8a', 'CD20'],
    ],
})
lineage_table
| cell_type | pos_markers | neg_markers | |
|---|---|---|---|
| 0 | Tumor | [CDH1, CA9, PD_L1] | [CD3e, CD20, SMA, CD68] |
| 1 | Stroma | [SMA, PDGFRB] | [CDH1, CD3e, CD20, MPO] |
| 2 | Myeloid | [CD68, CD163, CD14, CD11c, CD33, CD206, CD303,... | [CD3e, CD20, CDH1] |
| 3 | Neutrophil | [MPO, CD15, CD16] | [CD3e, CD20] |
| 4 | Bcell | [CD20, CD40, HLA_DR, B2M] | [CD3e, MPO, CDH1] |
| 5 | Plasma_cell | [CD38, CD27] | [CD20, CD3e, CD4] |
| 6 | BnTcell | [CD3e, CD20, CD7, B2M] | [CDH1, SMA, MPO] |
| 7 | CD8 | [CD3e, CD8a, GZMB, TCF7] | [CD4, FOXP3, CD20] |
| 8 | CD4 | [CD3e, CD4] | [CD8a, FOXP3, CD20] |
| 9 | Treg | [CD3e, CD4, FOXP3, ICOS] | [CD8a, CD20] |
3. Run gating#
Both algorithms are shown for comparison, but supervised training must use one explicit gating result. Below, tree_result is selected as gating_result:
tree probabilities → 98th-percentile cutoff labels → consensus-cleaned reference → prediction
To use soft gating instead, change only gating_result = soft_result.
soft_result = cg.run_soft_gating(
    adata, lineage_table, assay_name='exprs', unknown_thresh=0.4,
)
tree_result = cg.run_tree_gating(
    adata, lineage_table, assay_name='exprs', max_depth=4,
    min_cells=100, min_score=0.5, uncert_thresh=0.25,
    neg_strength=0.5, workers=1,
)

# This object supplies the probability matrix used to create training labels.
gating_result = tree_result
display(pd.DataFrame({
    'soft_label': pd.Series(soft_result['labels']).value_counts(),
    'tree_label': pd.Series(tree_result['hard_label']).value_counts(),
}).fillna(0).astype(int))
| soft_label | tree_label | |
|---|---|---|
| Bcell | 146 | 246 |
| BnTcell | 1231 | 1321 |
| CD4 | 154 | 13 |
| CD8 | 57 | 158 |
| Myeloid | 150 | 536 |
| Neutrophil | 63 | 47 |
| Plasma_cell | 12 | 7 |
| Stroma | 207 | 14 |
| Treg | 267 | 592 |
| Tumor | 25 | 3 |
| Uncertain | 0 | 1426 |
| Unknown | 2051 | 0 |
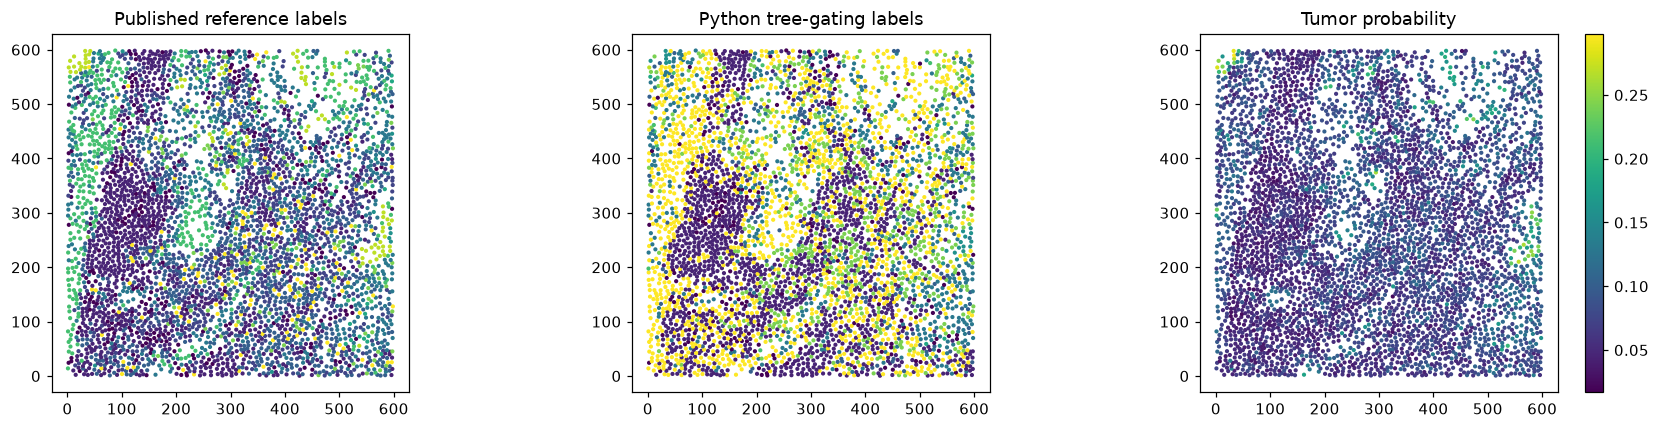
fig, axes = plt.subplots(1, 3, figsize=(16, 4))
plot_labelled_cells(adata, 'cell_type', ax=axes[0], s=3, title='Published reference labels')
plot_labelled_cells(adata, 'cell_type_hard', ax=axes[1], s=3, title='Python tree-gating labels')
plot_probability_map(adata, 'P_Tumor', ax=axes[2], s=3, title='Tumor probability')
plt.tight_layout()
fig, axes = plt.subplots(1, 2, figsize=(12, 4))
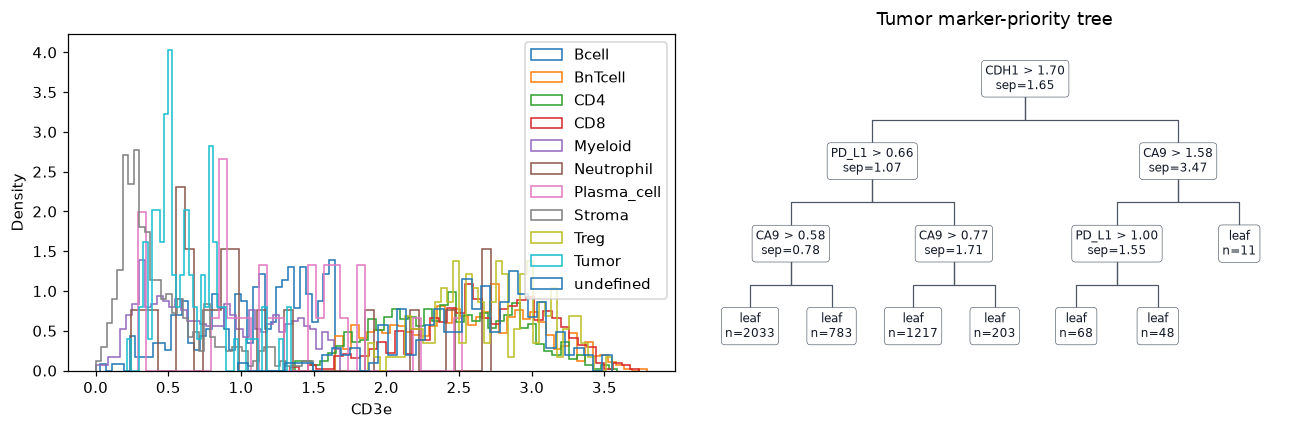
plot_marker_density(adata, 'CD3e', label_col='cell_type', ax=axes[0])
plot_celltype_tree(tree_result['trees']['Tumor'], title='Tumor marker-priority tree', ax=axes[1])
plt.tight_layout()
4. Create training data from the selected gating result#
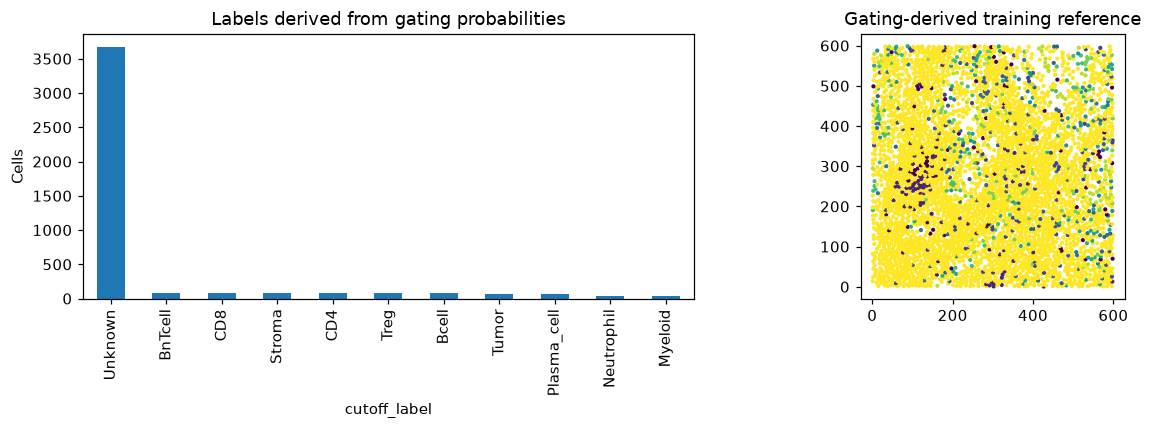
apply_cutoff_labels() computes a separate 98th-percentile cutoff for each cell-type probability. A cell becomes a training candidate only when it passes exactly one cutoff. Cells passing zero or multiple cutoffs remain Unknown, matching the R vignette.
gating_result = cg.apply_cutoff_labels(
    gating_result,
    cutoff_fn=cg.prob_quantile_cutoff,
    label_col='cutoff_label',
    unknown_label='Unknown',
)
adata = gating_result['spe']
reference_counts = adata.obs['cutoff_label'].value_counts(dropna=False)
# Validate against the probability matrix actually used, not notebook state
# from a lineage_table cell that may have been rerun independently.
allowed_labels = set(map(str, gating_result['prob_mat'].columns)) | {'Unknown'}
observed_labels = set(adata.obs['cutoff_label'].dropna().astype(str).unique())
unexpected_labels = observed_labels - allowed_labels
if unexpected_labels:
    raise RuntimeError(
        f'Unexpected cutoff labels: {sorted(unexpected_labels)}. '
        'Restart the kernel and run all cells so the updated package and '
        'gating_result are loaded together.'
    )
if adata.obs['cutoff_label'].isna().any():
    raise RuntimeError('cutoff_label contains missing values; rerun gating and cutoff creation.')
print(f"Reference cells: {(adata.obs['cutoff_label'] != 'Unknown').sum():,} / {adata.n_obs:,}")
display(reference_counts)
Reference cells: 688 / 4,363
cutoff_label
Unknown        3675
BnTcell          88
CD8              87
Stroma           79
CD4              77
Treg             77
Bcell            75
Tumor            67
Plasma_cell      60
Neutrophil       39
Myeloid          39
Name: count, dtype: int64
fig, axes = plt.subplots(1, 2, figsize=(12, 4))
reference_counts.plot.bar(ax=axes[0], title='Labels derived from gating probabilities')
axes[0].set_ylabel('Cells')
plot_labelled_cells(adata, 'cutoff_label', ax=axes[1], s=3, title='Gating-derived training reference')
plt.tight_layout()
5. Clean the gating-derived reference and predict unknown cells#
Both models train from label_col='cutoff_label'. Cross-validation changes inconsistent training candidates to Unknown in cleaned_core_label; prediction then fills cells outside that cleaned reference. A cutoff-derived class with fewer than two cells cannot be cross-validated and is also moved to Unknown.
knn_fit = train_custom_knn(
    adata, label_col='cutoff_label', cv_folds=3, repeats=2,
    agreement_thresh=0.5, k=5, method='pearson', seed=1,
)
knn_result = predict_unknown_with_knn(
    adata, knn_fit, label_col='cleaned_core_label', threshold=0.5, k=5,
)

rf_fit = train_custom_randomforest(
    adata, label_col='cutoff_label', num_trees=100, cv_folds=3,
    repeats=2, agreement_thresh=0.5, num_threads=1, seed=1,
)
rf_result = predict_unknown_with_randomforest(
    adata, rf_fit['model'], label_col='cleaned_core_label', threshold=0.5,
)
display(adata.obs[['cell_type', 'cutoff_label', 'knn_label_filled', 'soft_tree_label_filled']].head())
| cell_type | cutoff_label | knn_label_filled | soft_tree_label_filled | |
|---|---|---|---|---|
| 12_1 | CD8 | Unknown | CD8 | BnTcell |
| 12_2 | Bcell | Unknown | Bcell | Bcell |
| 12_3 | BnTcell | BnTcell | BnTcell | BnTcell |
| 12_4 | BnTcell | Unknown | CD8 | BnTcell |
| 12_5 | BnTcell | BnTcell | BnTcell | BnTcell |
6. Evaluate predictions#
tree_metrics = cg.calculate_f1(adata, ref_col='cell_type', pred_col='cell_type_hard')
knn_metrics = cg.calculate_f1(adata, ref_col='cell_type', pred_col='knn_label_filled')
rf_metrics = cg.calculate_f1(adata, ref_col='cell_type', pred_col='soft_tree_label_filled')
display(pd.concat({'tree': tree_metrics, 'kNN': knn_metrics, 'random forest': rf_metrics}, names=['method']))
| Category | Precision | Recall | F1_Score | Cell_Count | ||
|---|---|---|---|---|---|---|
| method | ||||||
| tree | 0 | Bcell | 0.695 | 0.602 | 0.645 | 284 |
| 1 | BnTcell | 0.617 | 0.789 | 0.692 | 1033 | |
| 2 | CD4 | 1.000 | 0.017 | 0.034 | 747 | |
| 3 | CD8 | 0.892 | 0.192 | 0.315 | 736 | |
| 4 | Myeloid | 0.778 | 0.611 | 0.684 | 683 | |
| ... | ... | ... | ... | ... | ... | ... |
| random forest | 5 | Neutrophil | 0.294 | 0.476 | 0.364 | 21 |
| 6 | Plasma_cell | 0.328 | 0.704 | 0.447 | 27 | |
| 7 | Stroma | 0.743 | 0.664 | 0.702 | 444 | |
| 8 | Treg | 0.386 | 0.775 | 0.516 | 138 | |
| 9 | Tumor | 0.920 | 0.920 | 0.920 | 88 |
31 rows × 5 columns
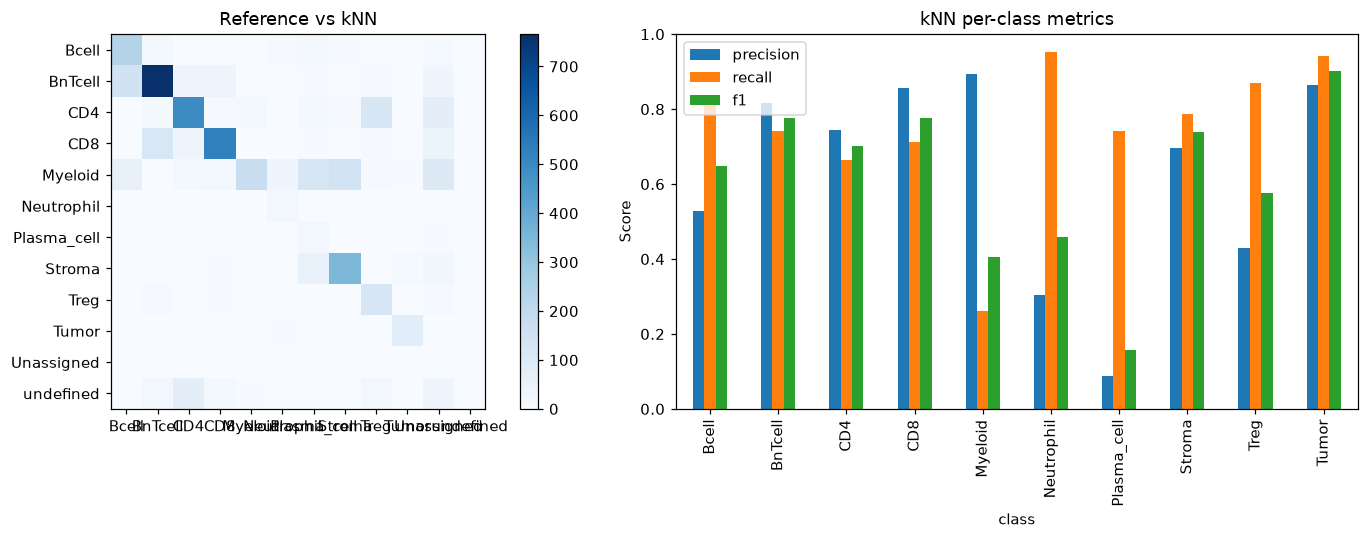
confusion = cg.label_confusion_matrix(adata, 'cell_type', 'knn_label_filled')
fig, axes = plt.subplots(1, 2, figsize=(14, 5))
plot_confusion_matrix(confusion, title='Reference vs kNN', ax=axes[0])
plot_class_metrics(knn_metrics.rename(columns={
    'Category': 'class', 'Precision': 'precision', 'Recall': 'recall', 'F1_Score': 'f1'
}), title='kNN per-class metrics', ax=axes[1])
plt.tight_layout()
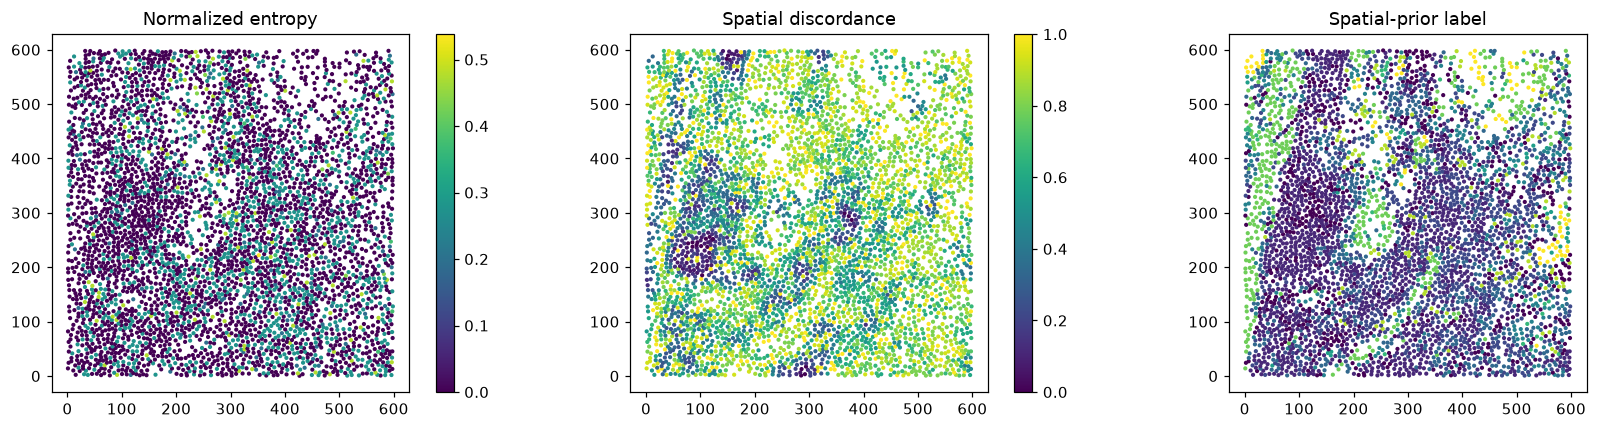
7. Probability uncertainty and protected spatial priors#
The packaged R demo already contains a complete KNN_P_* matrix. Using it here demonstrates uncertainty and spatial adjustment for every cell without filling artificial probabilities for reference cells.
r_knn_columns = [column for column in adata.obs if column.startswith('KNN_P_')]
full_probabilities = adata.obs[r_knn_columns].astype(float).copy()
full_probabilities.columns = [column.removeprefix('KNN_P_') for column in r_knn_columns]

uncertainty = calculate_uncertainty(
    full_probabilities, adata, sample_col='sample_id', k_spatial=15,
)
adata.obs[uncertainty.columns[1:]] = uncertainty.iloc[:, 1:]
calculate_spatial_prior_labels(
    adata, full_probabilities, k_spatial=15,
    lambda_=0.2, protect_threshold=0.85,
)
display(uncertainty.describe())
| entropy | gini_impurity | margin_uncertainty | spatial_discordance | |
|---|---|---|---|---|
| count | 4363.000000 | 4363.000000 | 4363.000000 | 4363.000000 |
| mean | 0.095018 | 0.164926 | 0.219078 | 0.677011 |
| std | 0.140225 | 0.240719 | 0.321931 | 0.242774 |
| min | -0.000000 | 0.000000 | 0.000000 | 0.000000 |
| 25% | -0.000000 | 0.000000 | 0.000000 | 0.533333 |
| 50% | 0.000000 | 0.000000 | 0.000000 | 0.733333 |
| 75% | 0.275556 | 0.491666 | 0.660638 | 0.866667 |
| max | 0.538163 | 0.740740 | 0.999965 | 1.000000 |
fig, axes = plt.subplots(1, 3, figsize=(16, 4))
plot_probability_map(adata, 'entropy', ax=axes[0], s=3, title='Normalized entropy')
plot_probability_map(adata, 'spatial_discordance', ax=axes[1], s=3, title='Spatial discordance')
plot_labelled_cells(adata, 'knn_spatial_label', ax=axes[2], s=3, title='Spatial-prior label')
plt.tight_layout()
8. Save the converted and annotated data#
Tree dictionaries are ordinary Python return objects. The cell-level results are stored in adata.obs and probability matrices in adata.obsm.
output_path = Path.cwd() / 'cytogater_r_demo_python.h5ad'
if SAVE_OUTPUT:
    adata.write_h5ad(output_path)
    print(f'Saved {output_path}')
else:
    print('Set SAVE_OUTPUT = True in the first cell to save:', output_path)
Set SAVE_OUTPUT = True in the first cell to save: /dskh/nobackup/biostat/projects/PRJ-cytogater/cytoGateR-py/examples/cytogater_r_demo_python.h5ad