spicyr#
Test whether cell types co-localise differently between groups of patients.
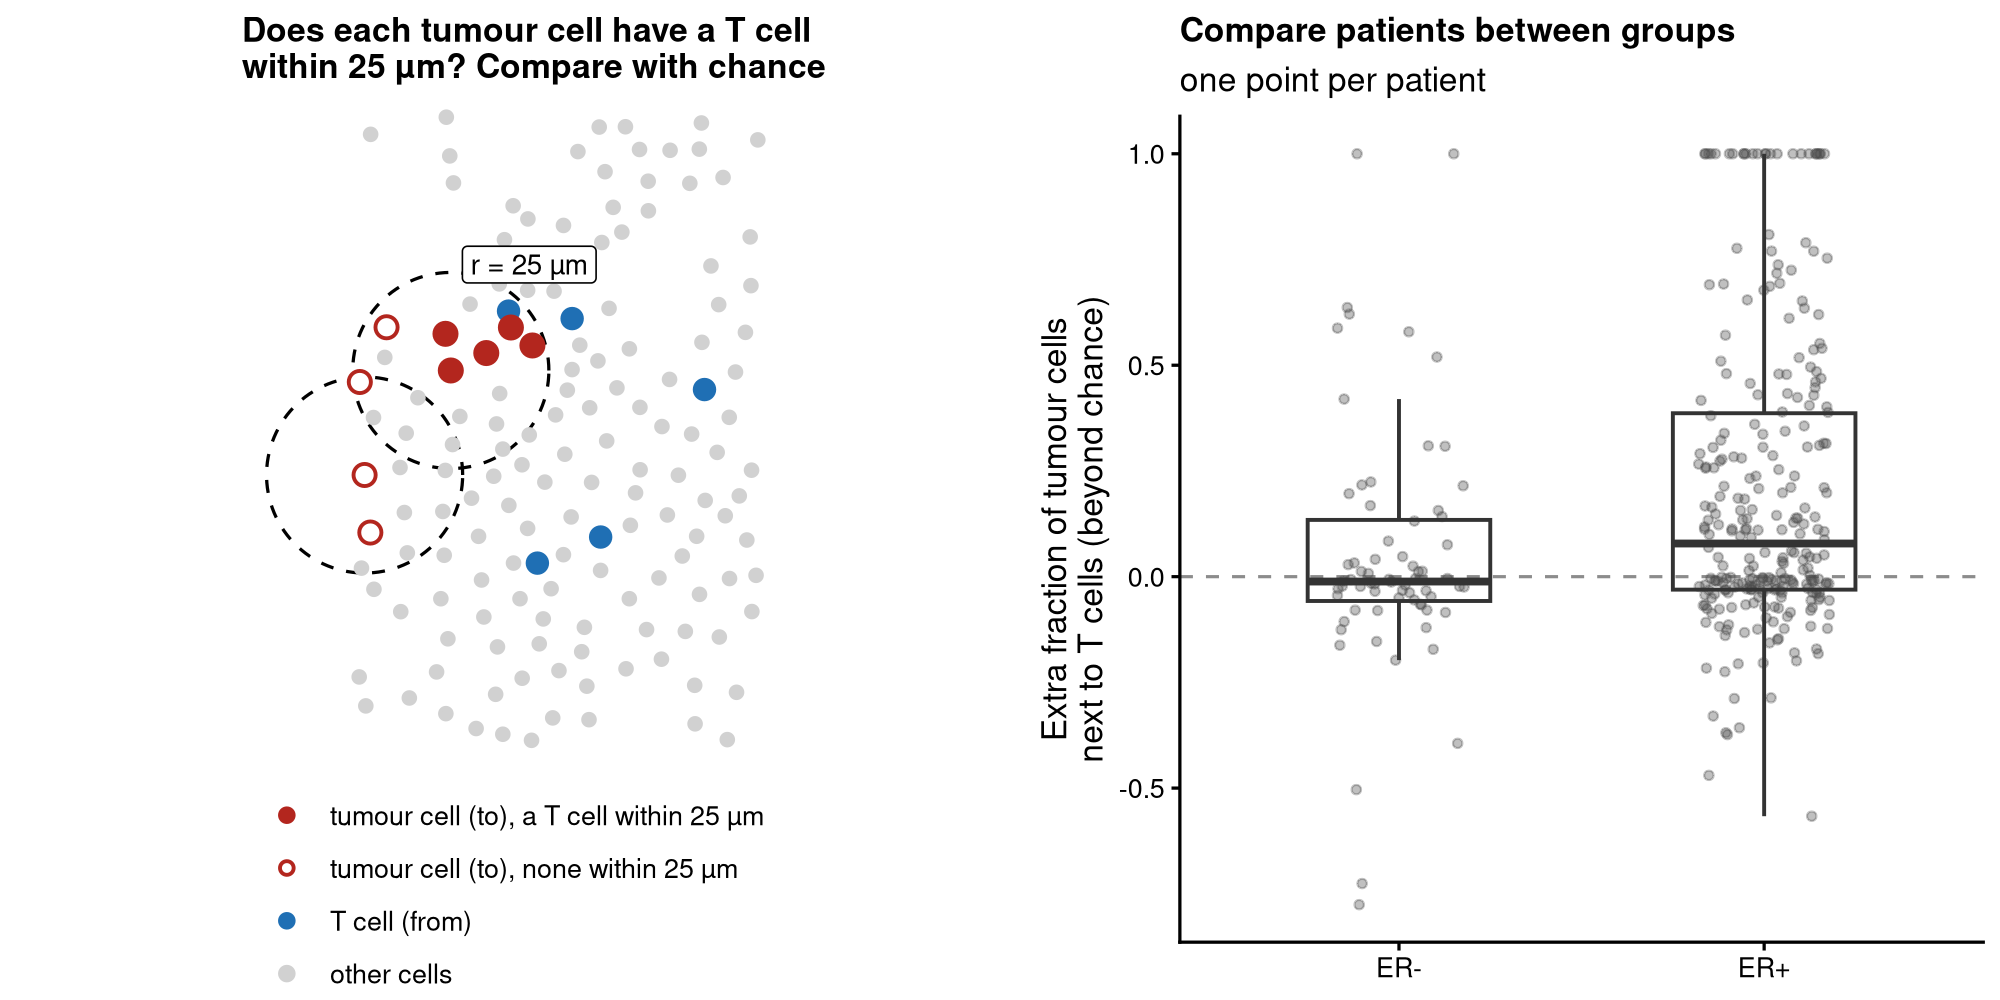
Do T cells gather around tumour cells more in one group of patients than in another? spicyr tests this for every pair of cell types in imaging and spatial transcriptomics data, comparing groups of patients or relating co-localisation to survival. For each image it asks what fraction of the cells of one type have a cell of another type within a radius, and compares that with what you would expect if the cells had been labelled at random, using the cells actually present. Holes, air spaces and uneven cell density therefore do not by themselves create a signal. Patients, not images or cells, are the units of the test. It needs the type and position of every cell (for example imaging mass cytometry, CODEX, MIBI, Xenium or CosMx), not spot-based data.
pip install "spicyr[plot,data,anndata] @ git+https://github.com/SydneyBioX/spicyr-py"
import spicyr

adata = spicyr.datasets.metabric_ali2020(as_anndata=True)      # breast cancer imaging mass cytometry
adata = adata[adata.obs["ER.Status"].isin(["neg", "pos"])].copy()
res = spicyr.spicy(adata, condition="ER.Status", subject="metabricId", r=25,   # reference group: "neg"
                   image_id="file_id", cell_type="description")
res.top_pairs()
res.signif_plot()
res.box_plot("T cells", "HR- Ki67+", interactive=True)
- Introduction to spicyr
- Overview
- Installation
- The data
- Testing every pair of cell types
- Seeing every pair at once
- Looking at one pair
- Looking at the images
- Tissue compartments
- Allocation or count?
- Patients with several images
- Adjusting for clinical covariates
- Which radius?
- Is co-localisation associated with survival?
- A check you can run
- How it works
- Small studies
- Very large data sets: SpatialData stores
- Reporting results
- spicyR in R
- Session information
- Reference