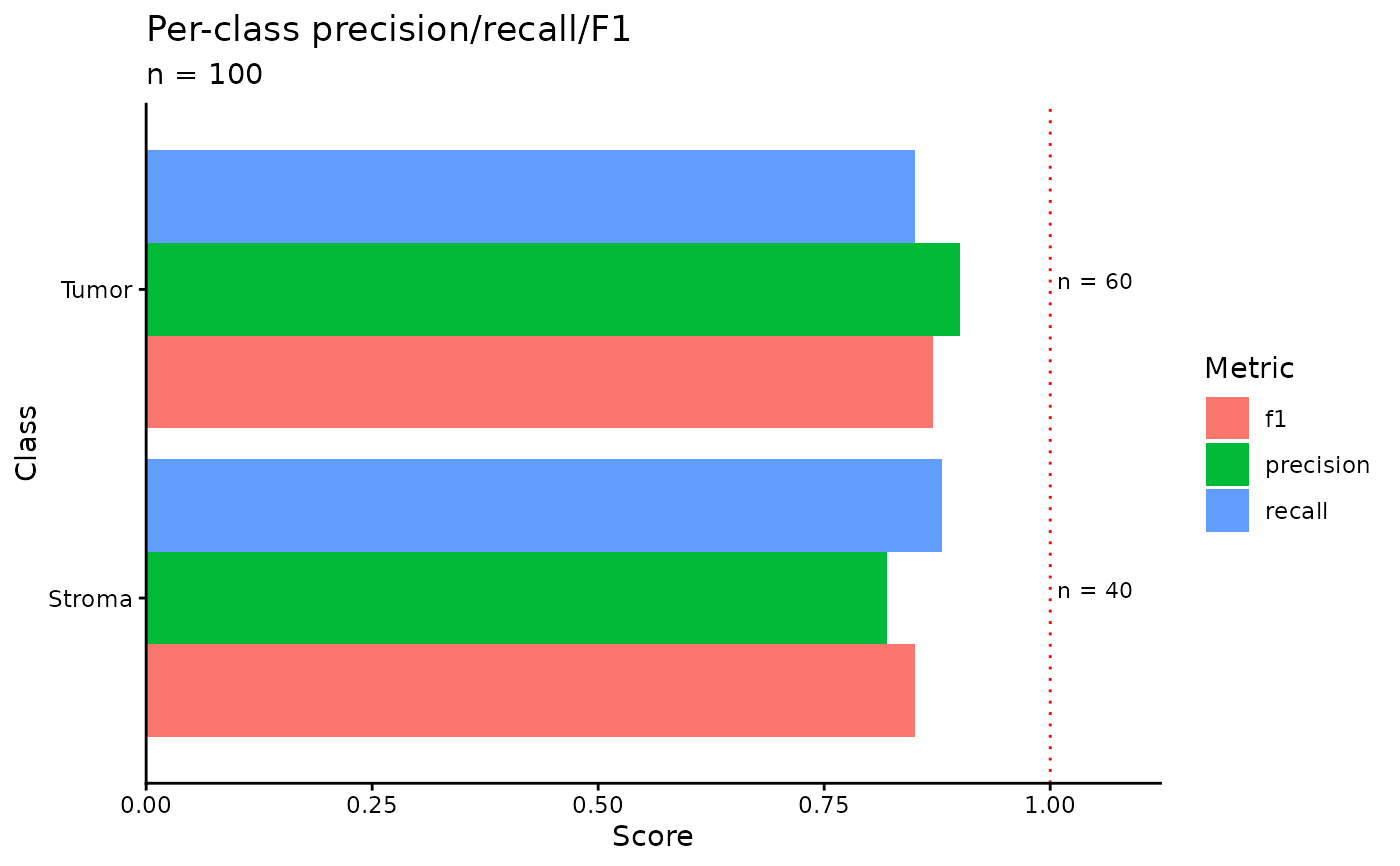
Displays grouped bar plots for per-class precision, recall, and F1 with
support annotations. If a `fold` column is present (e.g., cross-validation
results), draws boxplots per class and facets by metric.
Usage
plot_class_metrics(
  class_metrics,
  title = "Per-class precision/recall/F1",
  subtitle = NULL
)
Arguments
- class_metrics
Data frame with columns `class`, `precision`, `recall`,
`f1`, optionally `support`, and optionally `fold` for cross-validation.
- title
Plot title.
- subtitle
Optional subtitle for the plot. If `NULL`, an automatic
Examples
metrics <- data.frame(
  class = c("Tumor", "Stroma"),
  precision = c(0.90, 0.82),
  recall = c(0.85, 0.88),
  f1 = c(0.87, 0.85),
  support = c(60, 40)
)
plot_class_metrics(metrics)