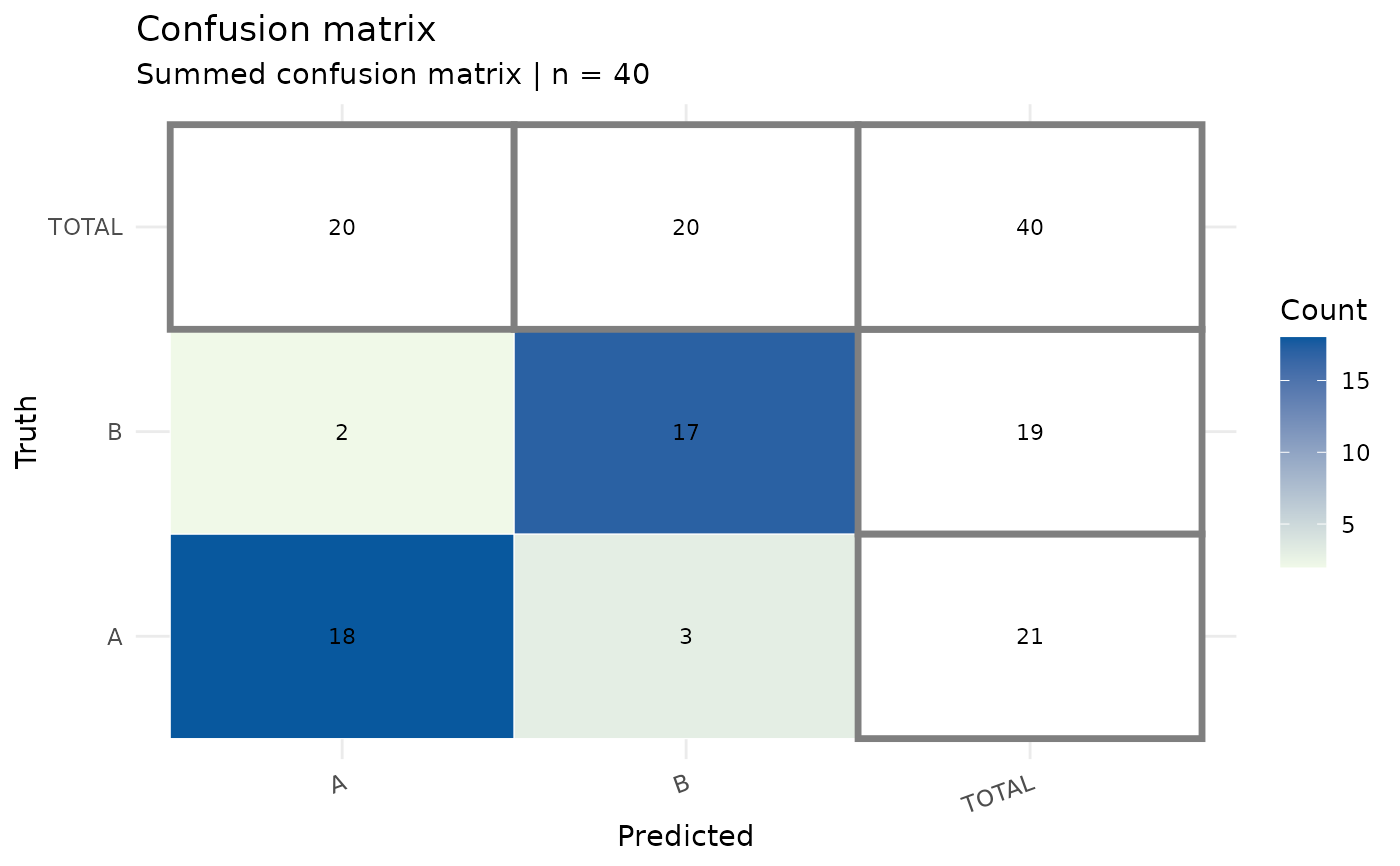
Creates a heatmap with counts overlaid for a confusion matrix (table or matrix) of truth vs. predicted classes.
Usage
plot_confusion_matrix(
  conf_mat,
  title = "Confusion matrix",
  subtitle = NULL,
  cv_folds = NULL,
  aggregated = TRUE,
  fill_low = "#f0f9e8",
  fill_high = "#08589e",
  plot_marginals = TRUE
)
Arguments
- conf_mat
A confusion matrix as `table`, `matrix`, or data frame with columns `truth`, `pred`, and `Freq`.
- title
Plot title.
- subtitle
Optional subtitle for the plot. If `NULL`, an automatic subtitle is generated (aggregation flag, CV folds if provided, and total `n`).
- cv_folds
Optional number of cross-validation folds to display in the subtitle. Use `NULL` to omit.
- aggregated
Logical. If `TRUE`, indicates the confusion matrix is summed/aggregated (used for subtitle text only).
- fill_low
Low-end color for the fill gradient.
- fill_high
High-end color for the fill gradient.
- plot_marginals
Logical. If `TRUE`, add an extra "TOTAL" row/column showing marginal totals and the grand total.