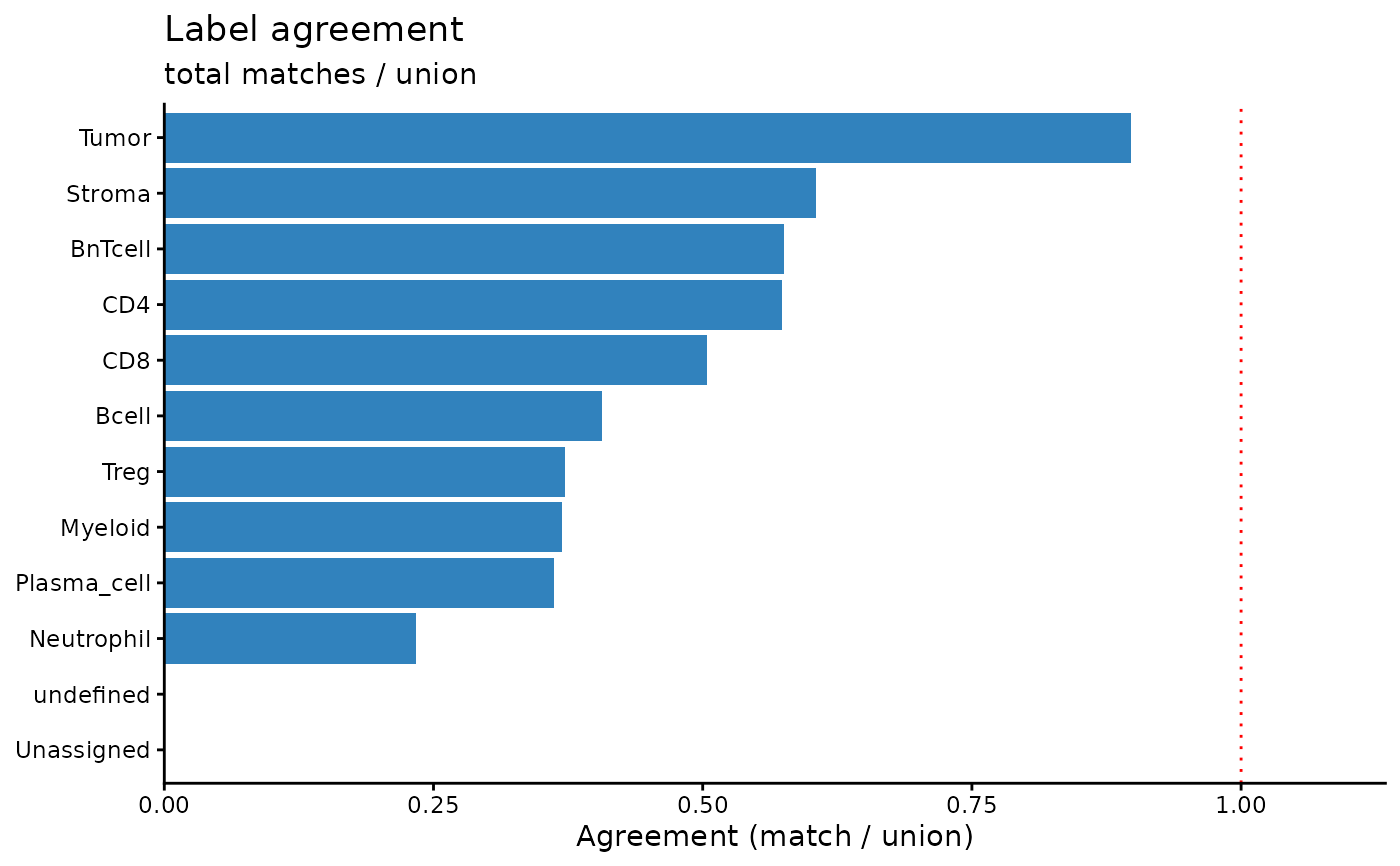
Computes per-label agreement (Jaccard overlap) between two label columns in `colData(spe)` and visualises it as a horizontal bar plot with class sizes.
Usage
plot_label_agreement(
  spe,
  label_col1,
  label_col2,
  drop_na = TRUE,
  title = "Label agreement",
  subtitle = "total matches / union"
)Examples
data("cytoGateR_example", package = "cytoGateR")
spe <- cytoGateR_example
plot_label_agreement(spe, "cell_type", "knn_label")