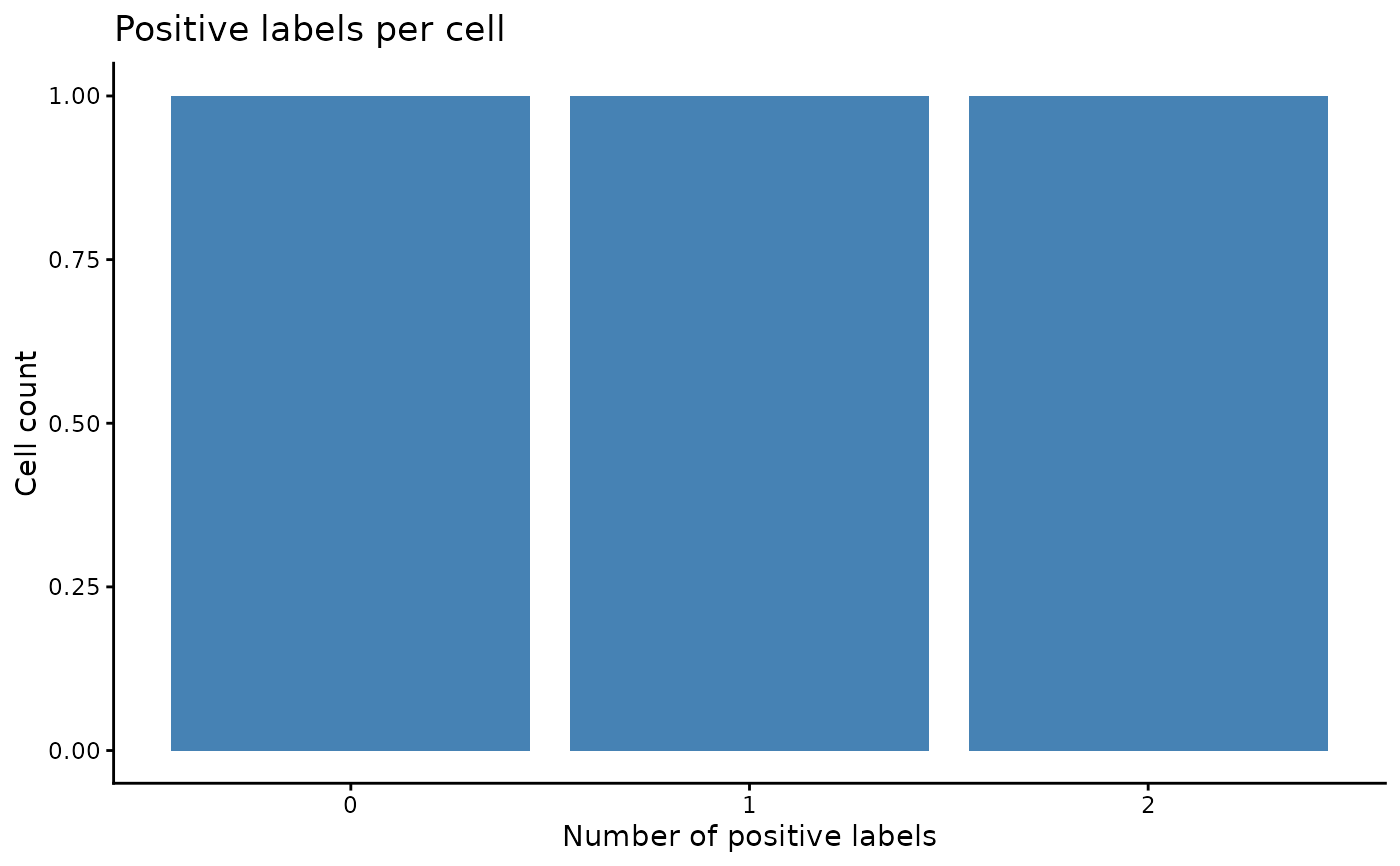
Given a logical/boolean label matrix (cells x cell types), counts how many
labels are positive for each cell and plots the distribution from 0 up to
the maximum observed positives.
Usage
plot_label_cardinality(
  label_mat,
  title = "Positive labels per cell",
  xlab = "Number of positive labels",
  ylab = "Cell count"
)
Arguments
- label_mat
Logical or numeric matrix with cells in rows and cell types
in columns.
- title
Plot title. Default "Positive labels per cell".
- xlab
X-axis label. Default "Number of positive labels".
- ylab
Y-axis label. Default "Cell count".
Value
A `ggplot` object showing counts per cardinality.
Examples
label_mat <- matrix(
  c(TRUE, FALSE, TRUE, TRUE, FALSE, FALSE),
  nrow = 3,
  dimnames = list(NULL, c("Tumor", "Stroma"))
)
plot_label_cardinality(label_mat)