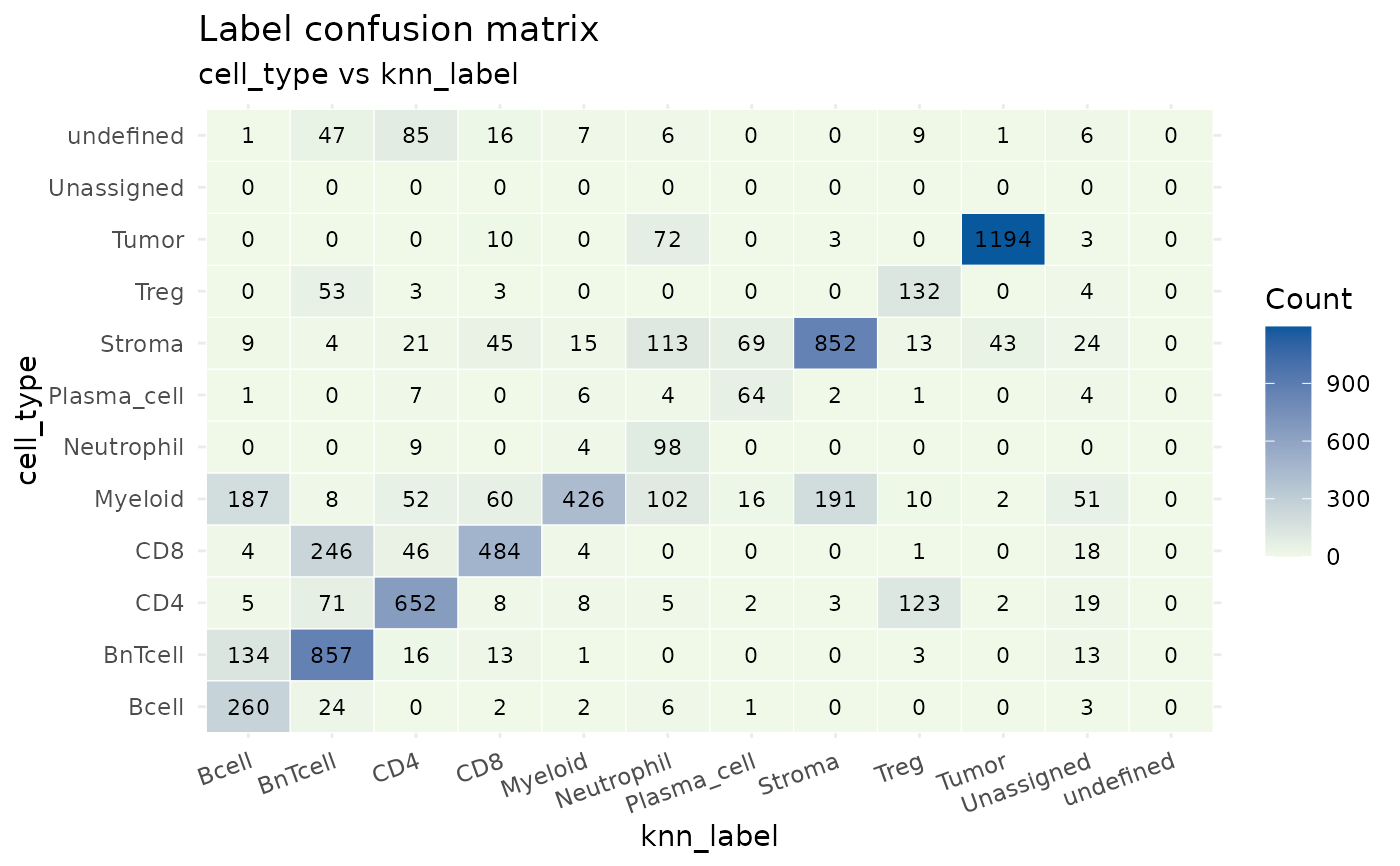
Plot confusion matrix between two label columns
Source:R/visualisation.R
plot_label_confusion_matrix.RdComputes a confusion matrix for two label columns in `colData(spe)` and visualises it with counts overlaid.
Usage
plot_label_confusion_matrix(
  spe,
  label_col1,
  label_col2,
  drop_na = TRUE,
  title = "Label confusion matrix",
  subtitle = NULL,
  fill_low = "#f0f9e8",
  fill_high = "#08589e",
  plot_marginals = FALSE
)
Arguments
- spe
A `SpatialExperiment`/`SingleCellExperiment`.
- label_col1
First label column name.
- label_col2
Second label column name.
- drop_na
Logical; drop rows with NA in either label. Default TRUE.
- title
Plot title.
- subtitle
Optional subtitle; defaults to "label_col1 vs label_col2".
- fill_low
Low-end color for the fill gradient. Default "#f0f9e8".
- fill_high
High-end color for the fill gradient. Default "#08589e".
- plot_marginals
Logical; if TRUE, plot marginal totals on the edges (right side and top) of the confusion matrix. Default FALSE.
Examples
data("cytoGateR_example", package = "cytoGateR")
spe <- cytoGateR_example
plot_label_confusion_matrix(spe, "cell_type", "knn_label")