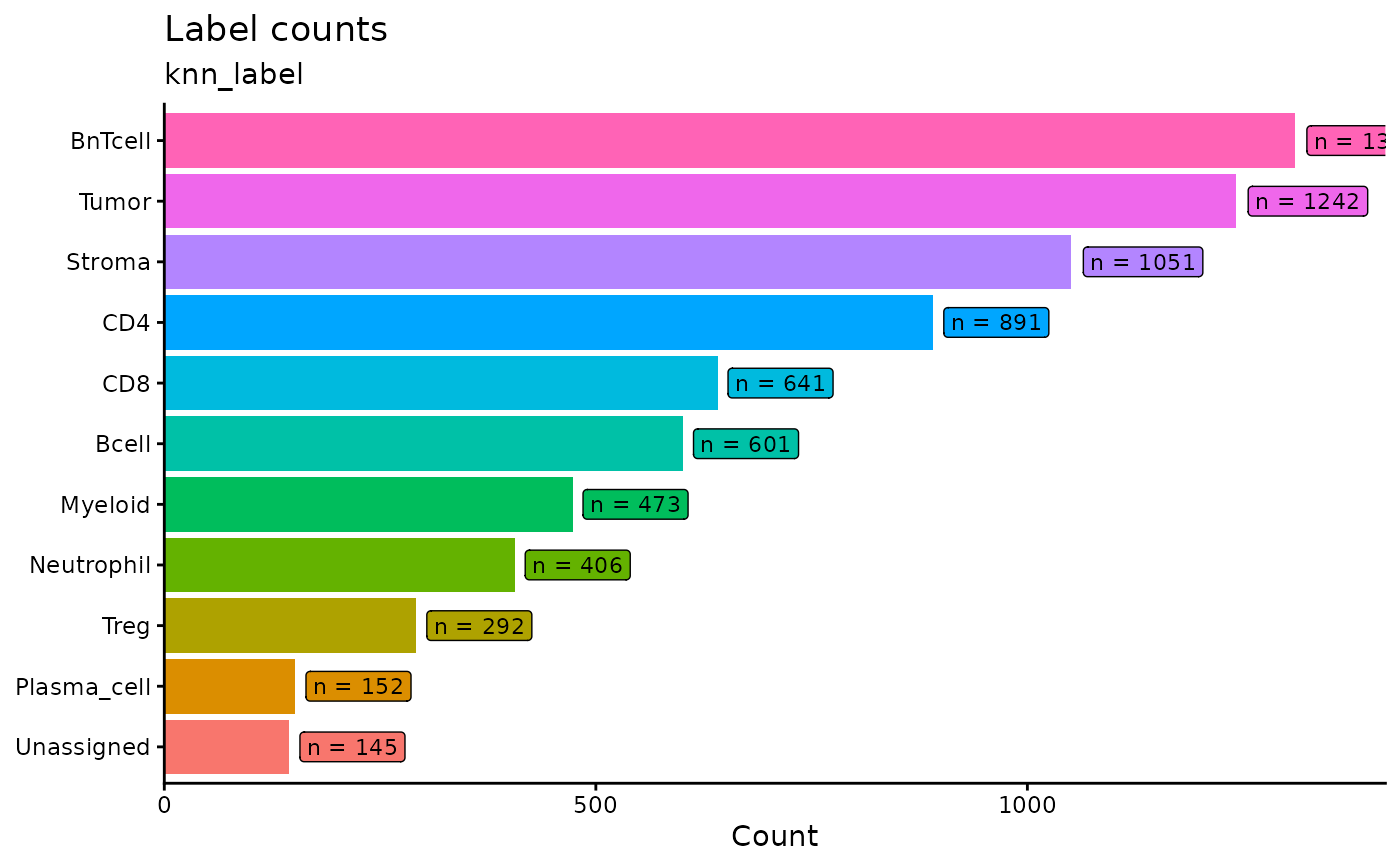
Horizontal bar plot of label counts with count annotations. Useful for quickly checking class balance in `colData()` label columns.
Usage
plot_label_counts(
  spe,
  label_col,
  title = "Label counts",
  subtitle = NULL,
  include_na = FALSE,
  show_legend = FALSE
)
Arguments
- spe
A `SpatialExperiment`/`SingleCellExperiment`.
- label_col
Column in `colData(spe)` containing labels to count.
- title
Plot title.
- subtitle
Optional subtitle. If no value provided, `label_col` is used.
- include_na
Logical; if TRUE, include missing values as "NA" level. Default FALSE.
- show_legend
Logical; show legend for bars. Default FALSE.
Examples
data("cytoGateR_example", package = "cytoGateR")
spe <- cytoGateR_example
plot_label_counts(spe, label_col = "knn_label")