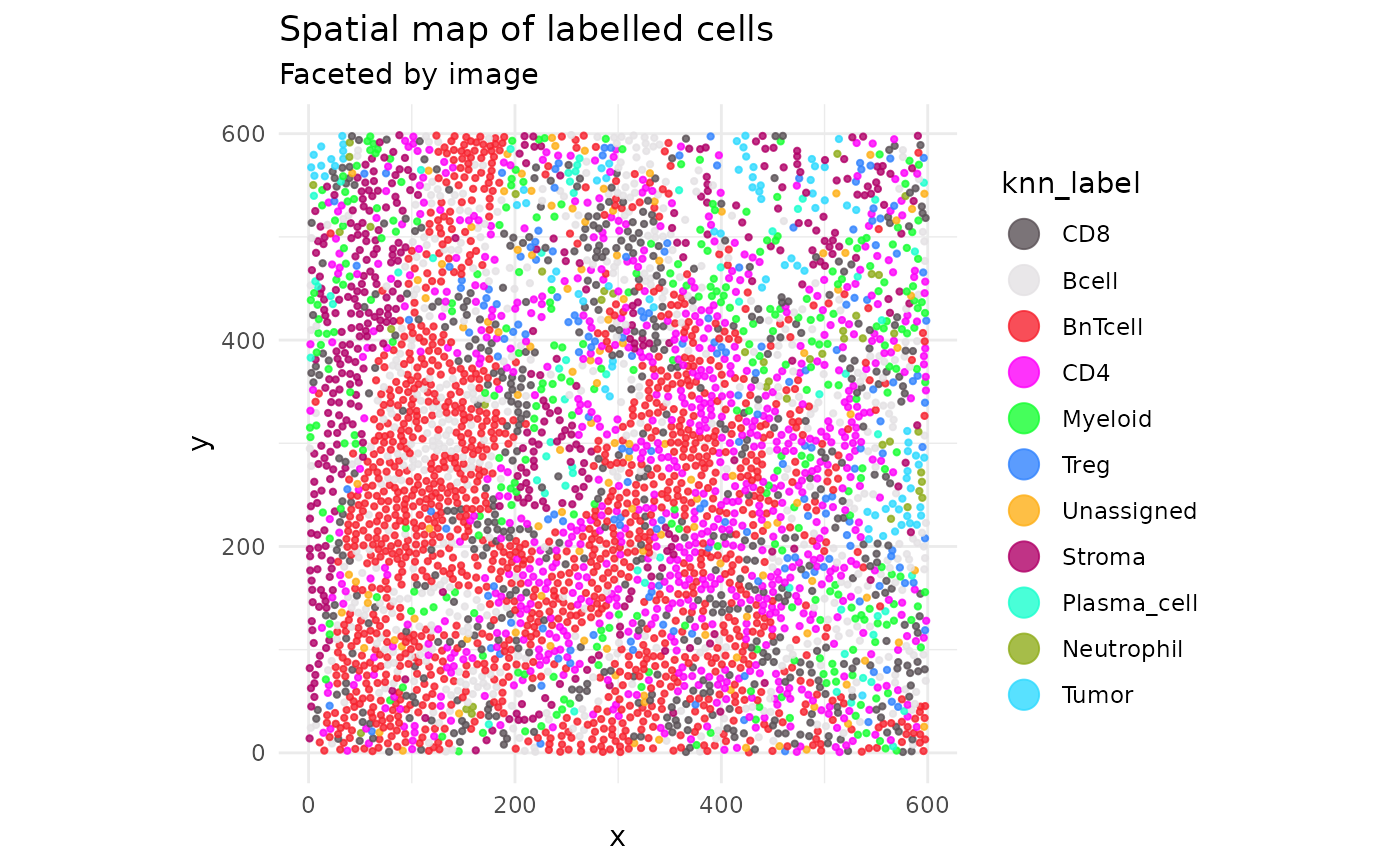
Takes cell labels and coordinates from a SpatialExperiment; can plot a single image or facet over multiple images with points colored by the provided label column.
Usage
plot_labelled_cells(
  spe,
  col_label,
  image_index = 1,
  image_col = "imageID",
  x_col = NULL,
  y_col = NULL,
  point_size = 0.8,
  label_levels = NULL,
  label_colors = NULL,
  drop_levels = FALSE,
  facet = TRUE
)
Arguments
- spe
SpatialExperiment object.
- col_label
Column in `colData(spe)` containing cell labels to color by.
- image_index
Index (or name) of the image(s) to view. Can be a single numeric, a numeric vector, or character vector of image IDs. Default 1.
- image_col
Column in `colData(spe)` containing image IDs. Default "imageID".
- x_col
Optional x-coordinate column in `colData(spe)`; auto-detected from `spatialCoords(spe)` when available.
- y_col
Optional y-coordinate column in `colData(spe)`; auto-detected from `spatialCoords(spe)` when available.
- point_size
Point size. Default 0.8.
- label_levels
Optional character vector of label levels to enforce for legend consistency. If provided, labels are coerced to a factor with these levels.
- label_colors
Optional named or unnamed vector of colors to use for the label levels. If provided alongside `label_levels`, lengths must match.
- drop_levels
Logical; if FALSE, keep unused levels in the legend. Default FALSE.
- facet
Logical; if TRUE, facet over selected images. If FALSE, plot a single image (first selected). Default TRUE.
Examples
data("cytoGateR_example", package = "cytoGateR")
spe <- cytoGateR_example
plot_labelled_cells(
  spe,
  col_label = "knn_label",
  image_col = "image_name",
  image_index = 1
)