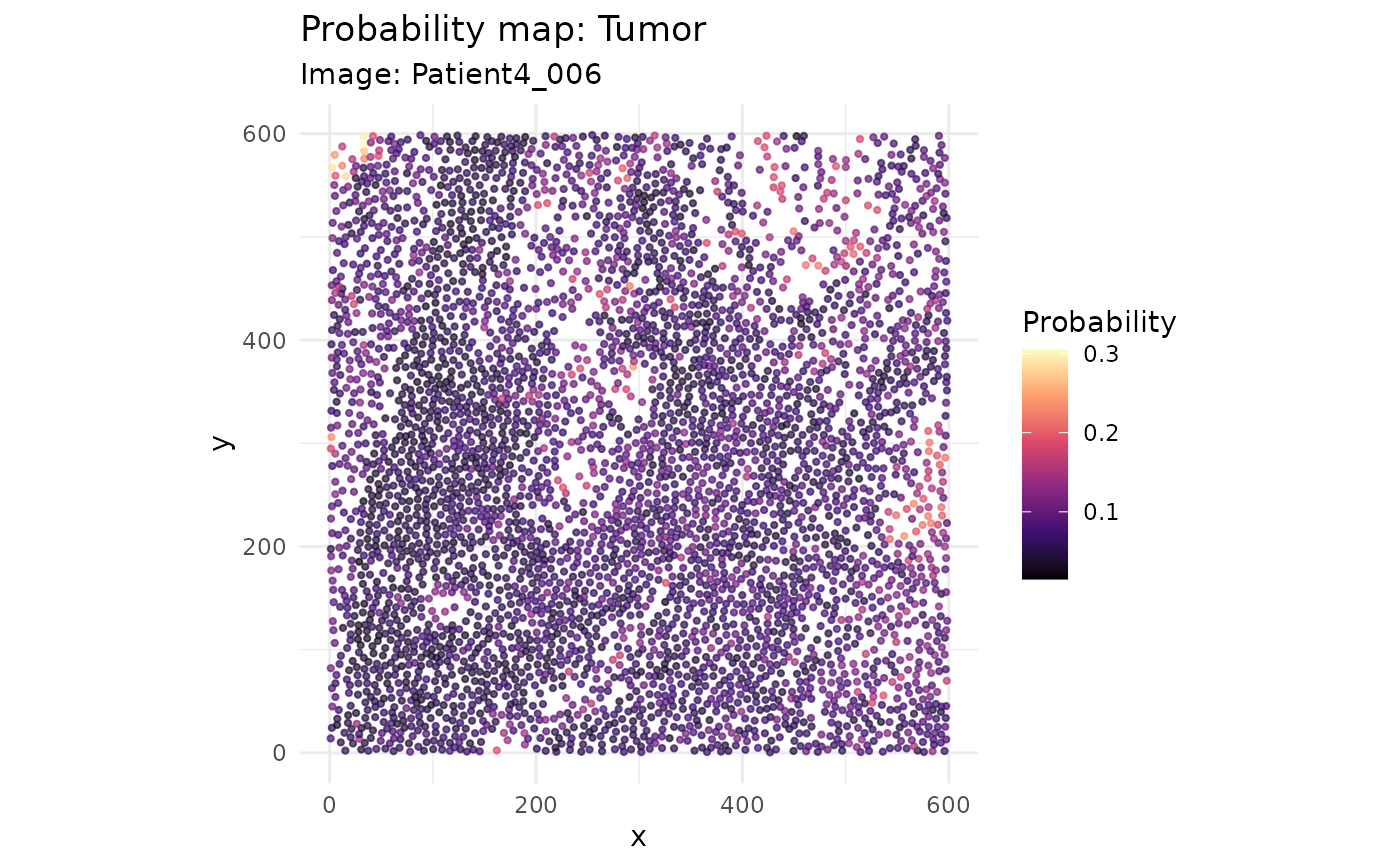
Draws a spatial scatter plot colored by soft-gating probability for a given cell type (e.g., "T cell", "Tumor").
Usage
plot_probability_map(
  spe,
  cell_type,
  image_col = "imageID",
  image_index = NULL,
  x_col = NULL,
  y_col = NULL,
  point_size = 0.8
)
Arguments
- spe
SpatialExperiment / SingleCellExperiment with P_* columns in colData.
- cell_type
Character. Must match the lineage_table$cell_type used in run_soft_gating().
- image_col
Column name for image ID (default "imageID").
- image_index
Numeric indices or character IDs of images to plot. Defaults to all images. If length > 1, results are faceted by image.
- x_col
Coordinate column names (default auto-detect).
- y_col
Coordinate column names (default auto-detect).
- point_size
Size of points.
Examples
data("cytoGateR_example", package = "cytoGateR")
spe <- cytoGateR_example
plot_probability_map(
  spe,
  cell_type = "Tumor",
  image_col = "image_name",
  image_index = 1
)