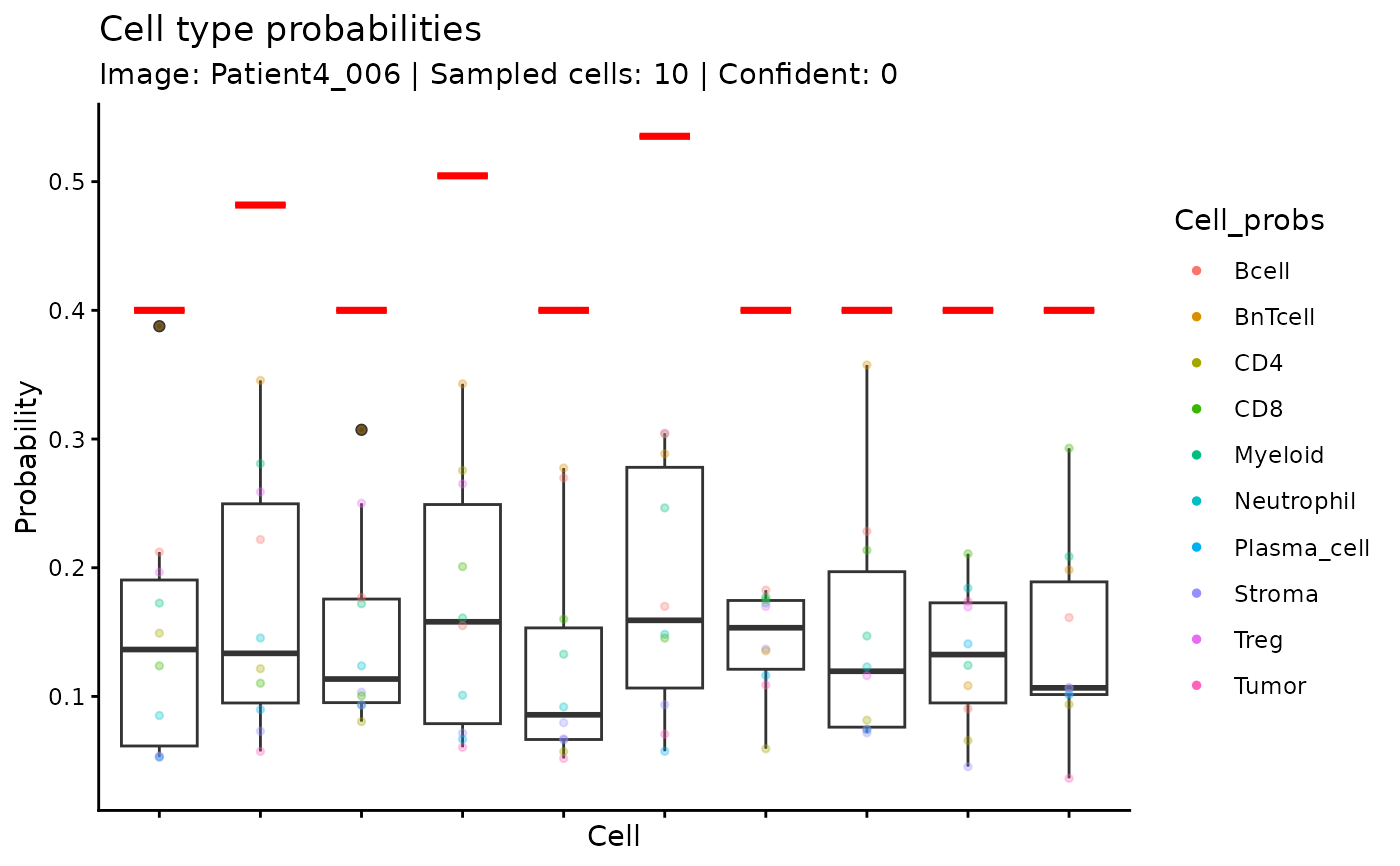
Plot the cell type probabilities of a random sample of cells
Source:R/visualisation.R
plot_rand_cell_probs.RdPlot the cell type probabilities of a random sample of cells
Usage
plot_rand_cell_probs(
  spe = NULL,
  image_index = 1,
  sample_size = 20,
  image_col = "image_name",
  flag_fn = NULL,
  base_thresh = 0.4,
  quantile_cut = 0.75,
  iqr_mult = 1.5,
  summary_fun = NULL
)
Arguments
- spe
A spatial experiment object returned by `run_soft_gating()` or `run_tree_gating()` containing cell type probabilities in `colData()`. If omitted, tries `res$spe` when available.
- image_index
Index of the image from which to sample cells. Default 1.
- sample_size
Number of cells to sample (capped at available cells). Default 20.
- image_col
Column in `colData` holding the image IDs. Default "image_name".
- flag_fn
Optional function taking a numeric vector of probabilities for a cell and returning a single logical indicating confidence. Defaults to a Tukey-style rule matching [custom_labels()].
- base_thresh
Minimum threshold used by the default rule. Default 0.4.
- quantile_cut
Quantile used by the default rule. Default 0.75.
- iqr_mult
IQR multiplier for the default rule. Default 1.5.
- summary_fun
Function that returns a single numeric summary value per group (e.g., median or upper whisker). The value is plotted as y/ymin/ymax in `stat_summary`. Defaults to the same rule as the confidence flag (max(base_thresh, Q3 + iqr_mult * IQR)).