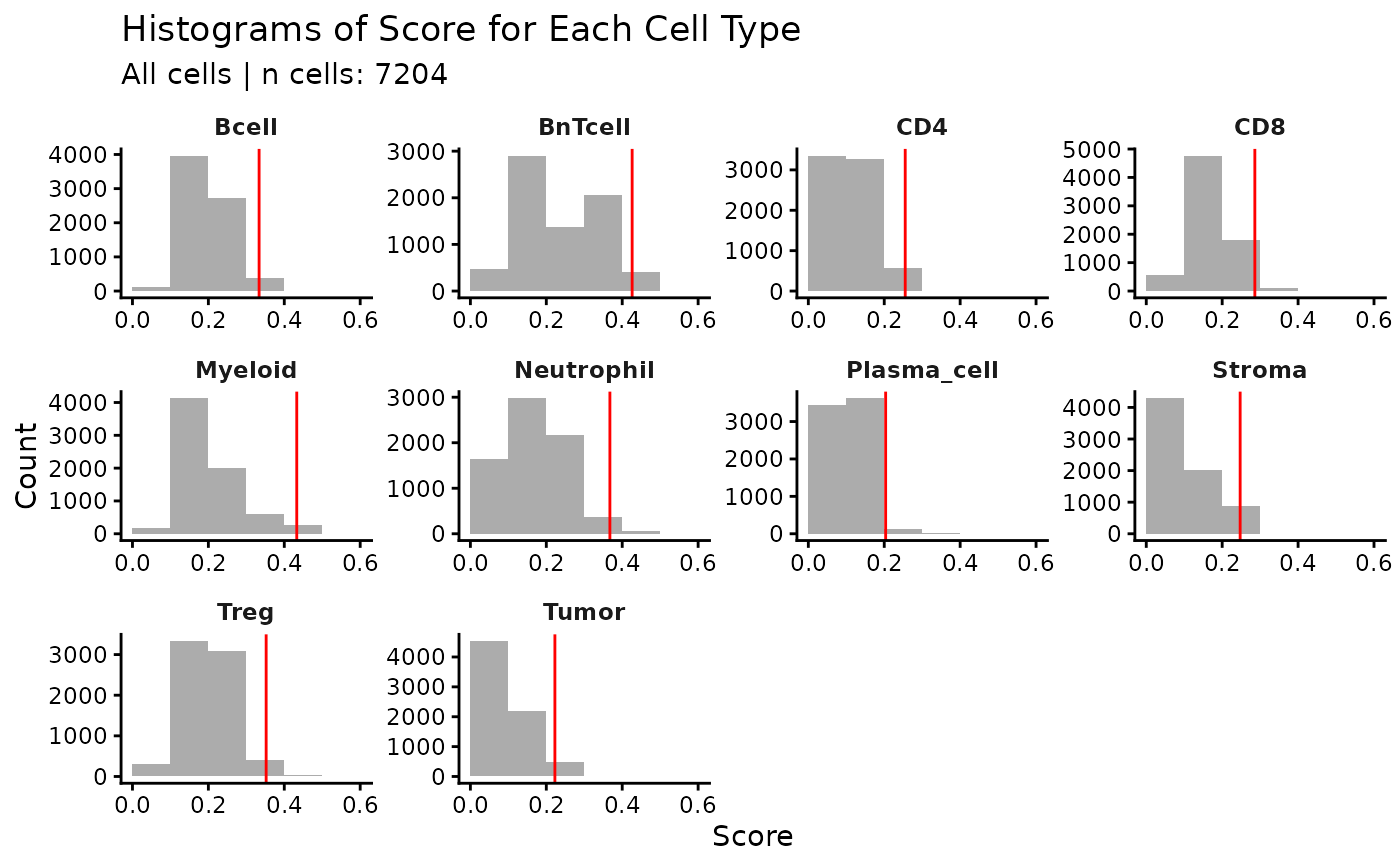
Faceted histograms of per-cell probabilities for each cell type, using the probability columns already stored in `colData(spe)` (e.g., `P_T_cell`, `P_Tumor`).
Usage
plot_score_hist(
  res,
  prob_prefix = "P_",
  binwidth = 0.01,
  drop_na = TRUE,
  cutoff_fn = prob_quantile_cutoff,
  label_col = NULL,
  label_levels = NULL,
  label_colors = NULL,
  drop_levels = FALSE
)
Arguments
- res
Result list containing an `spe` element with probability columns.
- prob_prefix
Prefix used for probability columns in `colData(spe)`. Default "P_".
- binwidth
Histogram bin width. Default 0.01.
- drop_na
Logical; drop NA probabilities before plotting. Default TRUE.
- cutoff_fn
Function taking a numeric vector of probabilities for a cell type and returning a single numeric cutoff to draw. Default [prob_quantile_cutoff()], which uses the 0.98 quantile.
- label_col
Optional column in `colData(spe)` used to color histograms by ground truth (or any label column).
- label_levels
Optional character vector of label levels to enforce for legend consistency.
- label_colors
Optional named or unnamed vector of colors to use for the label levels. If provided alongside `label_levels`, lengths must match.
- drop_levels
Logical; if FALSE, keep unused levels in the legend. Default FALSE.