library(ClassifyR)4 Procedure 3: Multi-Platform Precision Pathway
4.1 Introduction
Procedure 3 aims to construct a multi-platform precision pathway for determining the prognostic outcome of melanoma patients. This mimics a clinical diagnostic pathway, where given the results of a diagnostic test, a confident decision may be made, or the patient may be referred to collect more data from a different platform.
For this analysis, two cohorts are used. Both have clinical data, and miRNA and mRNA omics data.
- The Cancer Genome Atlas (T.C.G.A.): 62 patients. Both omics modalities use high-throughput sequencing.
- Melanoma Institute of Australia (M.I.A.): 42 patients. Both omics modalities use probe-based microarrays.
The prognosis outcome is classified as “Good” if survival is greater than 4 years from the date of tumor banking and “Poor” if survival is less than 1 year from the date of tumor banking. Patients who do not match a “Good” or “Poor” prognosis are excluded from analysis.
4.2 Setting up the environment and data objects
1. Load the R packages into the R environment
Timing ~ 6.5s
ClassifyR is used to perform all the demonstrated analyses below.
2. Import preprocessed datasets for analysis
Timing ~ 1s
melanomaTCGA <- readRDS("data/procedure3/TCGAmRNAandMicroRNA.rds")
melanomaMIA <- readRDS("data/procedure3/MIAmRNAandMicroRNA.rds")
colData(melanomaTCGA)
DataFrame with 62 rows and 4 columns
Outcome Sex Age Tstage
<factor> <factor> <integer> <numeric>
TCGA-BF-A1PX Poor Male 56 4
TCGA-D9-A4Z2 Poor Male 50 4
TCGA-EB-A3Y7 Poor Female 86 3
TCGA-DA-A1I7 Good Male 62 0
TCGA-DA-A1IA Good Female 32 2
... ... ... ... ...
TCGA-FS-A1ZM Good Male 74 2
TCGA-WE-A8ZR Poor Male 49 4
TCGA-FS-A4FD Good Male 39 2
TCGA-WE-A8K1 Good Male 74 3
TCGA-WE-A8ZO Good Female 73 3colData(melanomaMIA)DataFrame with 42 rows and 4 columns
Outcome Sex Age Tstage
<factor> <factor> <numeric> <numeric>
172 Good Female 84 2
249 Good Female 67 2
288 Good Male 54 2
36 Poor Female 70 2
1 Poor Female 75 4
... ... ... ... ...
350 Good Male 80 4
334 Poor Female 58 3
340 Poor Male 76 1
333 Good Male 59 3
351 Poor Male 64 1These commands read in a preprocessed MultiAssayExperiment containing two assays: miRNA and mRNA. Pairwise ratios of gene expression are used as predictive features. Patient age is at time of diagnosis and in years.
4.3 Precision pathways and evaluations
3. Creating a prognostic precision pathway
Timing ~ 260s
set.seed(2025)
pathways <- precisionPathwaysTrain(melanomaTCGA, "Outcome", mode = "combinatorial", nCores = 8)
The set.seed(1) command ensures that any subsequent operations involving randomness yield consistent results across runs. The second command trains multi-platform precision pathways using the two assays given the prognostic outcomes in the “Outcome” column in colData(melanomaTCGA).
costs <- setNames(c(50, 400, 700), c("clinical", "miRNA", "RNA"))
predicted <- precisionPathwaysPredict(pathways, melanomaMIA, "Outcome")
predicted <- calcCostsAndPerformance(predicted, costs)
Now, the constructed pathways are applied to M.I.A. dataset. Finally, the costs and performance of each potential pathway is calculated. Here, the cost of using clinical, mRNA and miRNA data have been set to $50, $700 and $400, respectively.
4. Precision Pathway Evaluation
Timing ~ 1.4s
summary(predicted) Pathway Balanced Accuracy Total Cost Score
1 clinical-miRNA 0.67 8400 4.50
3 clinical 0.60 2100 4.50
2 clinical-RNA 0.52 13800 3.00
4 miRNA 0.50 16800 1.75
5 RNA 0.50 29400 1.25Given the costs provided earlier in calcCostsAndPerformance, this command outputs the summary of performance and cost of each potential pathway for evaluation. Based on the score rankings clinical data alone, and clinical data followed by miRNA data are tied for the best precision pathway. Clinical data followed by miRNA has the best balanced accuracy, but it is considerably more expensive than clinical data alone. RNA data is the most expensive and tied for the worst balanced accuracy.
bubblePlot(predicted)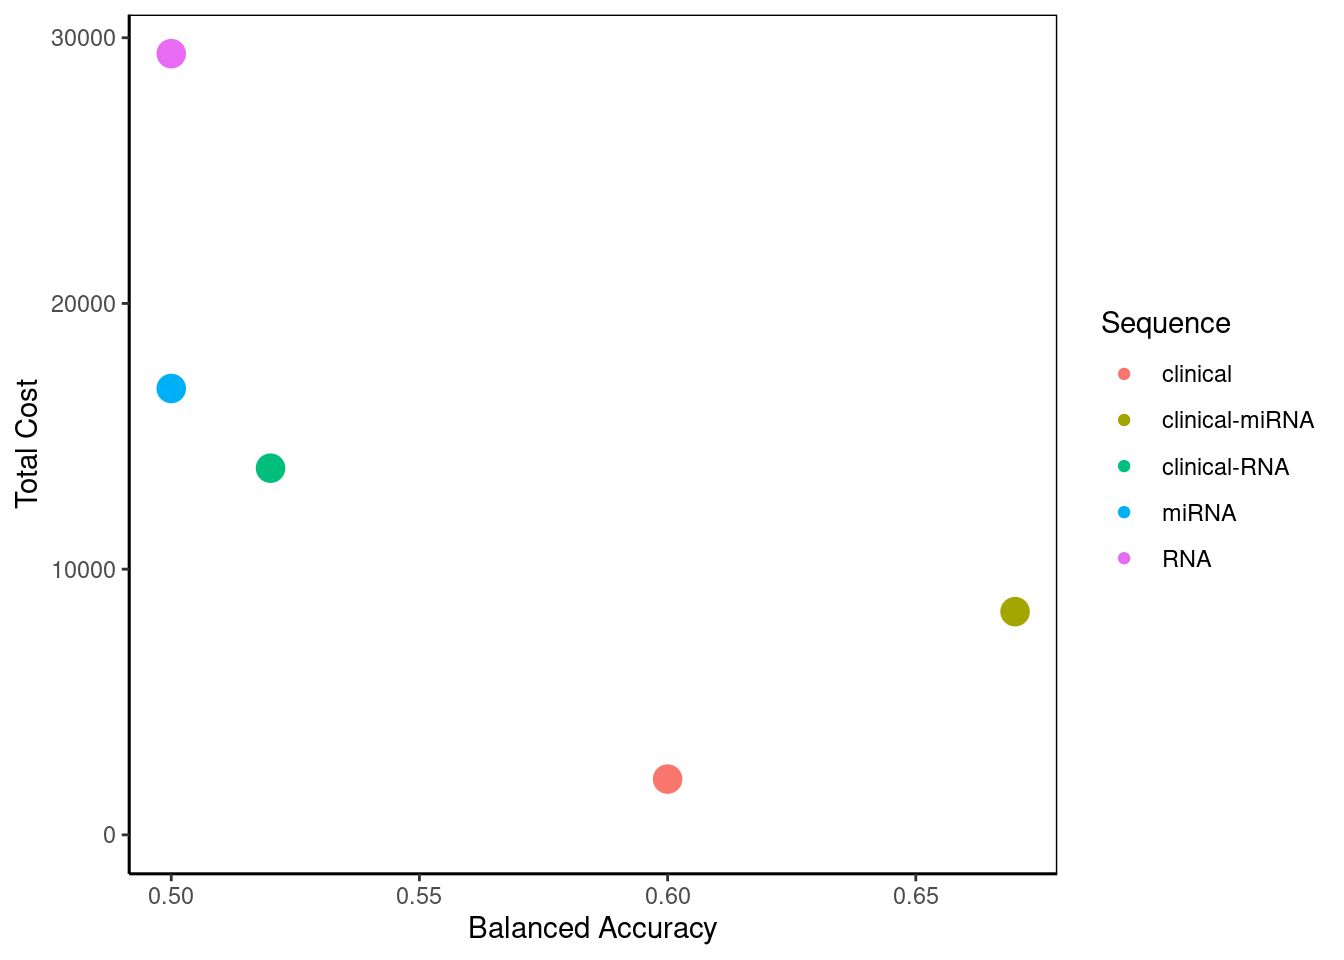
png
  2
This bubble plot visualises the summary created above. In a situation with more potential pathways, it would allow greater ease in selecting the best pathway to optimise cost and performance. Here, the user can decide for themselves which aspect they place their priority on.
plot(flowchart(predicted, "clinical-miRNA"))
Attaching package: 'data.tree'The following object is masked from 'package:Biobase':
AggregateConsider clinical-miRNA as the pathway of greatest interest. This function creates a flowchart to show the stepwise process for determining melanoma prognosis. Clinical data is first used to classify patients into three prognosis groups: • Good prognosis: 40% of patients (17 out of total 42). • Uncertain prognosis: 43% of patients (18 out of 42) • Poor prognosis: 17% of patients (7 out of 42). Thus, clinical data alone classifies 57% of patients, while 43% requiring further assessment.
For the Uncertain prognosis group (18 patients), additional analysis using miRNA refines the classification: • Good prognosis: None are identified as “Good”. • Poor prognosis: 43 (18 patients) are classified as “Poor”. This is why a potential pathway incorporating clinical, mRNA, and miRNA data was not considered, as the first two datasets alone provided a prognosis outcome for all individuals.
strataPlot(predicted, "clinical-miRNA")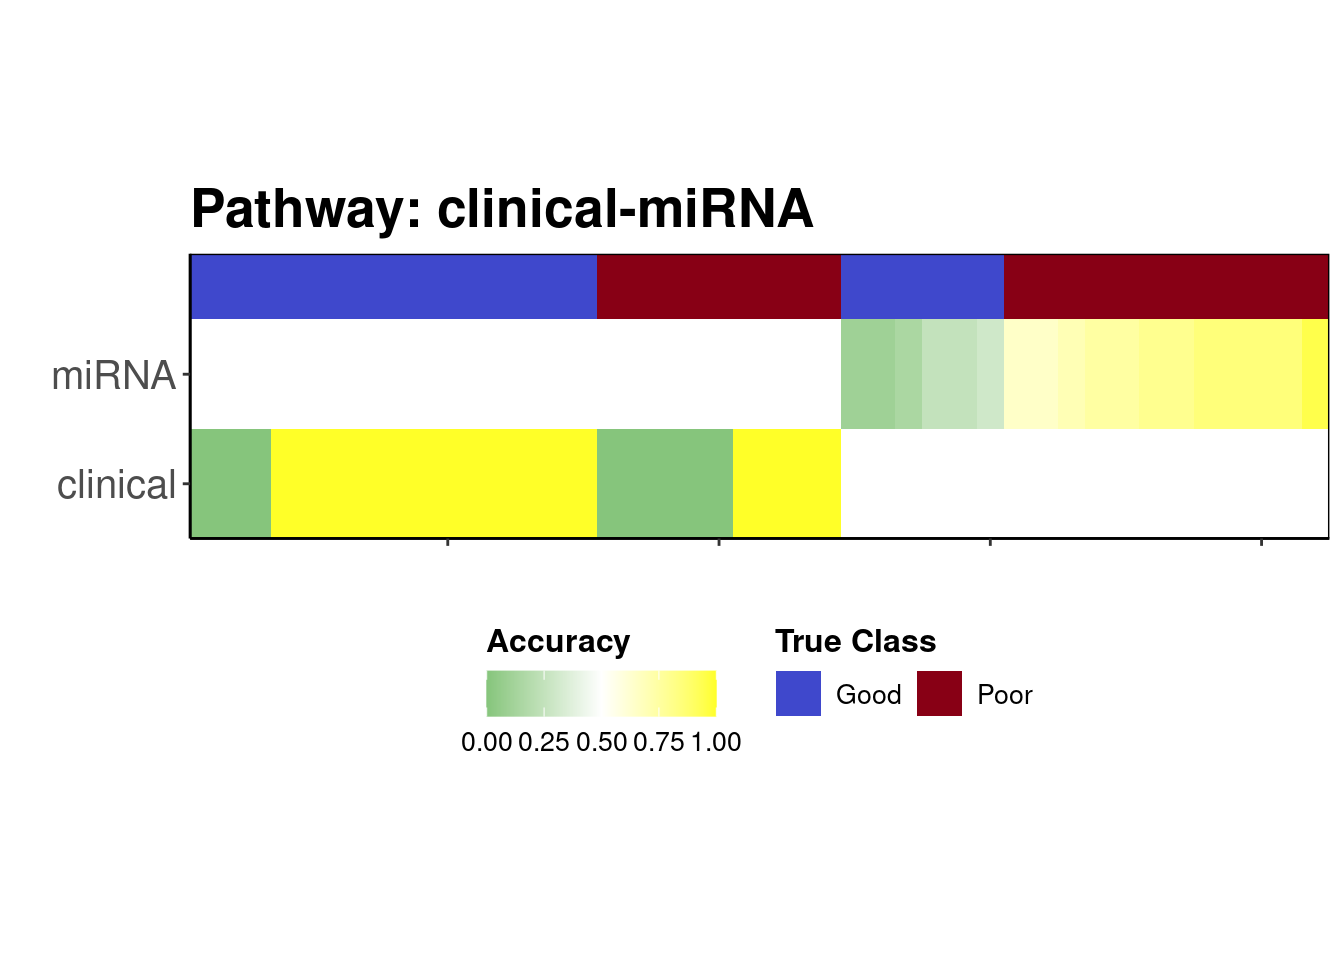
png
  2
This function creates a plot which allow us to visualise where the prediction went wrong. Samples were mostly predicted correctly using clinical data. For the individuals who were assigned to use miRNA, the classifier tended to predict the “Poor” class most of the time for all samples and hence the small number of “Good” samples incorrectly had a dire prognosis, which is arguably better than giving patients with a truly poor prognosis a predicted good prognosis when they need the most intensive treatment.